TERM

xauusd analysis 04/04/2022GOLD
it goes up a little and then goes down
+34631084680
any advice for free

SKLUSD - Trade Setup.Accumulate SKL between 0.125$-0.11$.
Place Stop Loss (SL) at 0.0897$.
Selling Target 1 : 0.155$.
Target 2 : 0.177$.
Target 3 : 0.195$.

Polkadot update April, 2022Imagine when all the puzzle pieces of the ecosystem will be complete. What will happen to
Polkadot #DOT #PolkaDot #DOTUSDT

seems APE is in a Horizontal channelAPE has broken its parallel channel and move onto a horizontal channel short term i'm still bullish on this with 1:2 RR ratio, for long tearm it''s boooommm....

Is this the end of the bull market?Hello to everyone, I know these are difficult days for some of you – Bitcoin and many Altcoins are in the edge of a free fall – and you are confused what will happen. Was that a bull trap? Is this the end of the bull market?
Last days Ukraine – Russia tensions are boosted by media over and over again. News like energy crisis, financial crisis, even an imminent World War 3 are reproduced all over the world and cause panic and uncertainty to most people.
Whales control the Media and manipulate the crowd caused fear or greed. Then whales take advantage of situations and buy or sell respectively.
Crisis Brings Opportunity.
Uninformed investors give them their coins at the lowest prices.
Politics is a very complicated game. Do not bet your hard-earned money on bad news or FOMO. Keep calm and let the market shows you what will happen.
Let’s take a look at the charts. Bitcoin is trading in sideways for over a year.
The crucial support level for a bearish reversal confirmation is at $28.8k.
A decisive breakdown and close below that -in HTF 1M-, will signal the end of the primary trend (bull market) and the start bear market.
At the time of writing this report, BTC is traded at $40.4k. Earlier today $39.6k support violated. If this level break, price may reach $35 – 33K very quick.
Why? Because below $39.6k there are many stop loss order, novice traders will be panicked and some of them will short sell to cover their losses.
We are still above the: short term bullish trendline
Crucial support $39.6k
Medium term bearish trendline
The white rectangles on the chart are the most crucial support/demand areas for Bitcoin.
If you’re bullish on Bitcoin place your limit buys near there. There is no guarantee that it will hit $35k or $29k again – before the primary bear market.
Risk management – Stay to your plan – Control your emotions. The most important of all.
If you can’t manage this situation, take some days off with family and friends. Do not overtrade.
If you like my report, like, follow me here & on Twitter.

Gold Bullish Once AgainGold bounce, and buy signals will likely take this to higher highs. 2200 or 2400 is still in play IMO. The weekly signal to sell can be disregarded as it will likely remain overbought.

gold analysis xauusd is in the neutral stage but in the bigger picture gold is in the long position and more likely to retest its all time high then if there is a breakout, the long term target is as big as the dept of the rectangle pattern. If gold lose its supply which it is shown on the chart, it will be back to the bottom of this rectangle pattern.

AMD BULLISH VISION long termTwo bullish patterns formed, one activate.
The price forms the two patterns above the major support of $100 and 50% fib.
Enjoy it...

HNT/USDT Analysis #TheCryptoCityHNT/USDT Analysis
Everything Is On The Chart.
Everything depends on the BTC movement
#TheCryptoCity #BTC #cryptocurrency #alice #trading #DYOR #crypto #learntrading

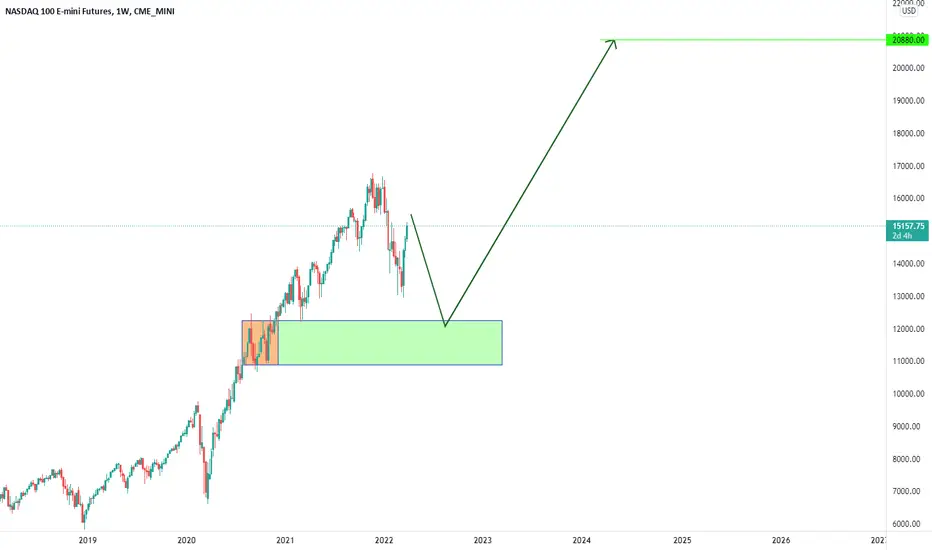
Nasdaq not a buy yetthere is a lot of surprises that can happen in the near future, starting from the tightening policies to the tension and the sanctions that stress the world economy.
This is a fair area to buy the Nasdaq on the long run as an investment.
XTZ Cup and Handle 2xHello everyone,
This is my first time doing a public analysis, so I hope you won't be too harsh on me. :)
I have analyzed Tezos (XTZ), and the idea based on the daily chart, I have observed a cup handle formation that has been trying to form for a long time and I wanted to share it with you.
As can be seen in the graphic, the cup part is completed, the handle part scrapes the bottom.
Even though I took it as the bottom part of the cup and made an approximate date and price estimate, it may not be exactly the same.
2x (8.500ish and beyond) might be expected for Tezos, which I have foreseen for a period of about 2-2.5 months.
Farewell

38 $ KCShello !
lets keep it simple .
volume increased which is bullish
the chart looks good as well
so we got 2 path for next few days
Green path : holding 21 support level which was first resistance before breaking it.
Red path : losing 21 and start to accumulate below 21 level or at the worst case , testing 17 - 18 $.
the only bearish sign is RSI right now !
for reaching to 35 - 38 $ , we need to break 23 level resistance first and next major resistance is around 28 $.
breaking 28 $ = moon
.....
not financial advice !
stay safe and healthy
.....
let me know what do you think and share your ideas and charts
thank you.

Falling Wedge- Watching CloselyCRM holding quite a big falling wedge here on its daily chart after closing Friday reclaiming the 50-Day SMA. CRM is currently sitting on its 50-Day SMA as well as the .786 FIB level, which also happens to fall right on a major RSI-Based Supply level. CRM additionally has multiple gaps on the upside to fill. Bullish on CRM long-term and will be watching closely for a breakout if buyers continue to step in (broader market conditions permitting)- Just some FIB levels along with some RSI-based supply and demand zones to keep an eye on in the meantime- Price Targets Attached Below
- Buyer volume picking up relative to seller volume
- Reclaimed the 50-Day SMA
- Falling Wedge
- Gap Fill on the Upside circa $238.87-$243.22
PT1- $212.74
PT2- $214.68
PT3- $217.10
PT4- $219.52+

BTC Long Term BullishI drew a bunch of lines on a chart awhile back. Contemplated which colors I should use. Seems like a big ol' cup and handle to me. Been forming for awhile now. I am a caveman.

Bitcoin Weekly MACD | Mid Term BullishResemblance on weekly macd
10/1/22 - 25/2/22 formation looks like a variation of the bottom formation adam & eve 26/11/19 - 25/2/19
Its confirmed on daily chart as macd volume rises.

AUDUSD Short ScenarioThe price reached a supply zone and we can see that it bounced from that zone meaning that the selling pressure might start. I would recommend to search for selling opportunities on the lower timeframes. If you want to to sell now the risk to reward ratio is 4.3.

BTC long target $117000 minimum In week TF writing W pattern and my prediction of minimum $117000 after 2-3 month for #BTC
and the current situation in the world will encourage investors and even ordinary people to try to keep the value of money and investments.. and for this, the best asset is bitcoin! and people have already realized this trend! sanctions for different countries of the world are also a direct way to use bitcoin to circumvent them. so all fundamental indicators also show an increase of at least 117-120 thousand dollars per bitcoin!


Axie created a triple bottomaxie triple bottom let's goooo. resistance and support marked on chart. will we make a run to ath? let's hope btc stays bullish. not a financial advisor do your own research. the king paves the way. always use low leverage. always use stop loss and have an exit strategy. good luck and like/follow if you liked my chart.

Strong Supply area (Possible target if BTC HOLDS)If BTC holds, the Supply area is a possible target.
Watch out if BTC loses zone there is an possiblity that there is a fadeout out of the compression.
If Market maker move is inplay possible target lower then the Compression

Bullish 2W Candle Close for BTCUSDBearish momentum is stalling out, even while the threats of war, hyperinflation, and Bitcoin "failure" loom over the heads of investors.
While we remain in bearish waters, ultimately the lack of momentum here in either direction, up or down, spells out a NEUTRAL outlook for a majority of remaining crypto investors. The majority of whom are buying en masse, including both retail and whales. While this is very bullish on-chain, fundamentally, and historically--will the rise of precious metals like Gold, Silver, and Nickel still manage to stunt Bitcoin's upward price action in the short term?
Are you buying or waiting it out?

PLTR don't fail me now!NYSE:PLTR
Daily Chart
EMA (Exponential Moving Average): 20 EMA is yet to cross the 50/100/200 EMA... For longterm buys, this is still in the buy zone although this means that the stocks hasn't recovered from the death cross (50 EMA crosses the 200 EMA).
TTM Squeeze: Squeezed ! Momentum is behind the stock... Working to fill the gap down from Feb. 16th.
Fib Levels: Smooth sailing from 0 fib to 1 fib ($10.27 to $13.02). Having trouble holding above the 1 fib . Would it fall back to the 0 level or go parabolic? That is the question. Facing strong resistance at $14.28 and at the next fib level ($14.85). This stock is practically facing a lot of resistance all the way to $29.29
Candle Stick: Summary of last 5 candles equate to a bullish movement. Bullish Pin Bar although ending red isn't too bad...
Pattern: Do you see a double bottom (feb 24th and Mar 15th)? In general, PLTR is still in a falling wedge. Will this double bottom be what reverse the pattern?
News: Sigh, no matter the news, good or bad, this stock just seems to want to trend down.
History: The last 2 earnings have resulted in a downward trend even with great numbers. Everyone and their mama is talking about this stock... Maybe the Wall Street Bets community will bring about a squeeze someday.
Company is worth Trillions with no debt, Great Enterprise customer base but the stock is tanking... hmm...
