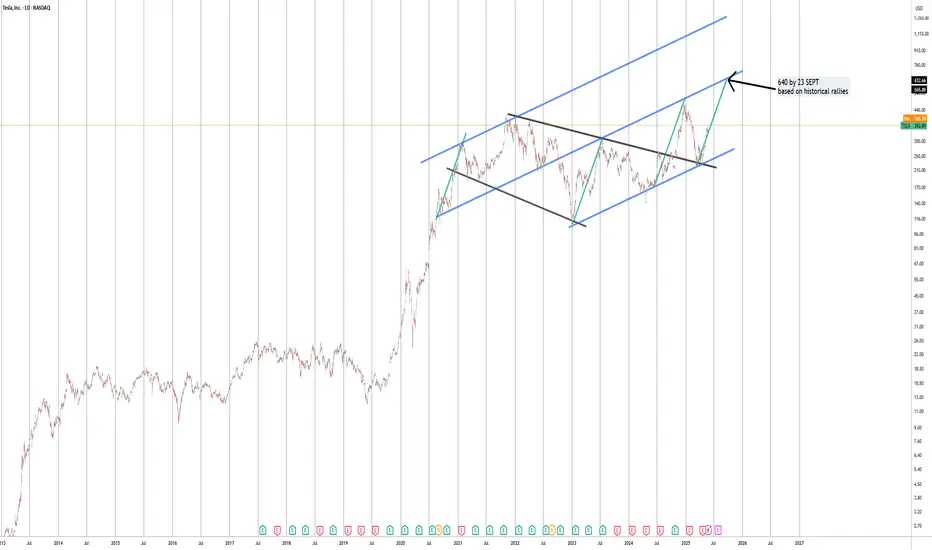
Tesla price target based on geometryTesla $640 by sept based purely on price geometry and trend analysis. In the past Tesla has shown rallies matching in time and price
Tesla
$TSLA: Big bull flag? 400 soon? But tariff talks againMarket mix up. NASDAQ:TSLA Eyeing this, positioned for a couple weeks out on my calls which are ugly red but, I think this is setting up for something in the next few weeks? Although, feels like tariff talks again are not letting this run as well. #NFA

Tesla Inc. (TSLA) Technical Analysis and ForecastTSLA has demonstrated strong upward momentum since the market opened today, reaching a resistance level around the $362 zone.
From a technical perspective, there is potential for a short-term pullback to the $354 area, which aligns with the top of the support zone, also known as the "right shoulder" of the prevailing pattern.
Should this support level hold, we may anticipate a continued upward move, targeting higher price levels.
Key Levels to Watch:
Support Levels:
Primary Support: $354 zone
Secondary Support: $321 zone (as a deeper stop loss level)
Resistance/Take Profit Levels:
Target 1 (Take Profit): $440
Target 2 (Take Profit): $480 (previous all-time high)
Traders should approach this setup with caution, as always, adhering to sound risk management principles.

TSLA: Break-out above bull flag, possible cup and handle?So, a few days ago, I posted about a bull flag forming on the daily chart for Tesla. This flag pattern was a period of consolidation following an incredibly whooping rally from the $270 mark to around $350 (around a 30% or so gain).
Today, we have a new break-out from this consolidation period, and as of writing right now, Tesla is up 7%. It has now breached the $350 resistance level.
If you look more closely, the chart pattern resembles something close to a cup and handle pattern. You have the cup base going from the 20th of Feb 2025 all the way to the 14th of May 2025. Our bull flag which lasted between the 14th of May until the 23rd of May (last Friday), could as well be a handle for the cup base.
A break-out from not only the bull flag but the cup and handle could signal a massive move towards $400, however $375 and $390 could be points of resistance, and it would be wise to watch for a cooldown in the short-term.
Upcoming this week, it might worth mentioning that NASDAQ:NVDA earnings could have a strong impact on tech and affect Tesla - even if Tesla isn't much exposed to AI as the semiconductors.
To conclude, target is $390-$400 however as we all know, nothing is guaranteed :)
Note: Not financial advice. My analysis is not advice, rather just an idea. Please do your DD as well.

Update on Nuclear Stocks SMR, OKL0 + NEW IDEAS VRT, TSLA OKLO, SMR going through the roof. NNE is trailing today. Sold out most of the RKLB.
Lets go over the SPY, QQQ which are flagging now after holding support.
Liking this VRT and LTBR AND LUNR for potential swings along with HIMS!
Lets dig into the charts and see whats up!

This 3 Step System Will Show You The Trending StockThis is a powerful chart for you to watch.
Because its following the Rocket booster
strategy.
The Rocket booster Strategy has 3 Steps;
1-The price has to be above the 50 EMA
2-The price has to be above the 200 EMA
3-The price should gap up or trend up.
In order for us to know whether the price
will trend up we are using the ADX indicator.
We make sure that the Blue line
Is rising between the Green line
and the Red line .
This confirms the last step of the rocket booster
strategy.Also remember that the NASDAQ is up-trending.
Rocket boost this content to learn more.
Disclaimer;Trading is risky please use a simulation account
for trading before you trade with real money.
Also learn risk management and profit taking strategies.

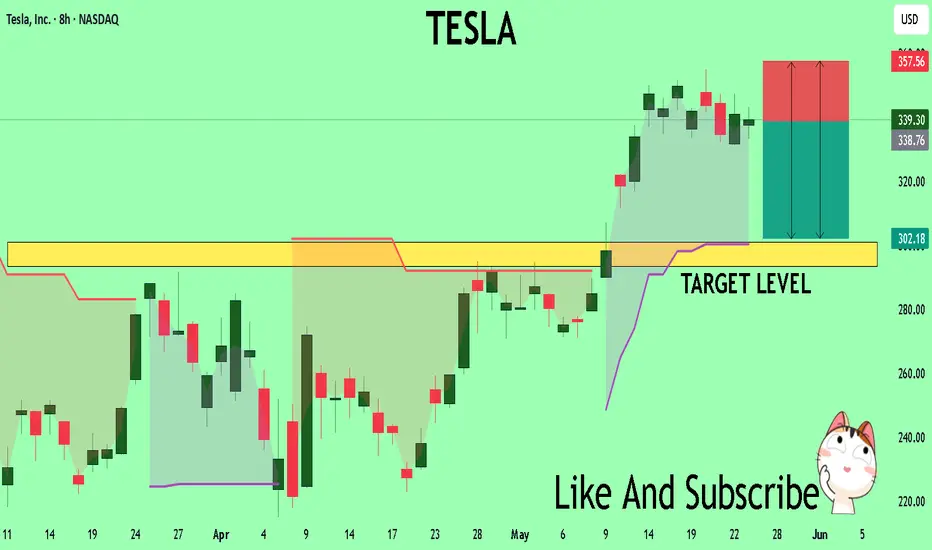
TESLA: Short Trade with Entry/SL/TP
TESLA
- Classic bearish formation
- Our team expects fall
SUGGESTED TRADE:
Swing Trade
Sell TESLA
Entry Level - 339.30
Sl -354.47
Tp - 301.39
Our Risk - 1%
Start protection of your profits from lower levels
Disclosure: I am part of Trade Nation's Influencer program and receive a monthly fee for using their TradingView charts in my analysis.
❤️ Please, support our work with like & comment! ❤️

TESLA Massive Short! SELL!
My dear friends,
My technical analysis for TESLA is below:
The market is trading on 339.30 pivot level.
Bias - Bearish
Technical Indicators: Both Super Trend & Pivot HL indicate a highly probable Bearish continuation.
Target - 301.0
Recommended Stop Loss - 357.56
About Used Indicators:
A pivot point is a technical analysis indicator, or calculations, used to determine the overall trend of the market over different time frames.
Disclosure: I am part of Trade Nation's Influencer program and receive a monthly fee for using their TradingView charts in my analysis.
———————————
WISH YOU ALL LUCK
Tesla (TSLA): Daily uptrend support and potential bull flagHey guys/gals,
Today, I am showing you the daily chart of Tesla ( NASDAQ:TSLA ), which provides an idea of where this stock may be heading next.
As you can see, the support trendline from the 21st April low is still well intact. Currently, Tesla is holding this line very well and over the past few days, it's clear that it has also been in consolidation mode. Taking a deeper look, the consolidation period seems to be forming a potential bull flag pattern. Minus the upper wick which could be a price anomaly due to a fake-out, a real actual breakout from the bull flag in combination with a bounce from the support trendline could help Tesla reach $365 as the next resistance point.
On the contrary, and it does depend strongly on what the broader market does next (as Tesla is a high beta stock), its flag pattern may not play out and a break below the support line could send the stock all the way to first support at £325.
This wholly depends on the wider market. On my other posts, I've made it clear that S&P 500 AMEX:SPY is also forming a flag pattern, with many other indices following suit.
Note: Not financial advice.

Tesla - Don't get confused right here!Tesla - NASDAQ:TSLA - is about to create the bullish reversal:
(click chart above to see the in depth analysis👆🏻)
2025 has been a rough year for Tesla so far. With a drop of about -50%, Tesla is clearly breaking the average retail trader. But the underlying trend is still quite bullish and if position strategy, risk execution and mindset control are all mastered, Tesla is a quite rewarding stock.
Levels to watch: $275, $400
Keep your long term vision!
Philip (BasicTrading)

$Tsla will continue to go bullish after a short term pullbackNASDAQ:TSLA is in a bullish market overall speaking.
the price will probably continue to go up after this short term pullback!

TESLA: Can it worth $4,000 a share buy end of 2026?Tesla is bullish on its 1D technical outlook (RSI = 65.527, MACD = 22.160, ADX = 43.922, being on a bullish wave to recover the ATH. Since the 2019 low the prevailing long term pattern is a Channel Up and the recent Feb-March correction resembles COVID's in March 2020. If that's the case then the stock is on a powerful long term bullish wave that can reach the 4.5 Fibonacci extension before the 5.0 time Fib. This implies that TSLA price per share can be $4,000 by the end of 2026. Do you think that's realistic?
See how our prior idea has worked out:
## If you like our free content follow our profile to get more daily ideas. ##
## Comments and likes are greatly appreciated. ##

Tesla Faces Resistance, Conclusion: 1,206 New All-Time High?The Tesla stock, TSLA, is facing resistance right now; what to expect?
Expect additional growth but...
Good afternoon my fellow trader, Tesla will continue growing, mark my words.
Volume has been rising now since January 2024, that's a long time. Almost a year and a half with more and more action joining this stock and this is one of the most traded stocks in the whole world. Increasing volume is a very strong bullish signal.
The highest volume session came on the 7-April week and this week closed green. It produced the highest volume since February 2023.
Back in 2023, trading volume started to rise in January and this signaled the start of a long-term bullish trend, higher highs and higher lows. This trend is still valid today.
The bullish bias is confirmed. Let me show you.
» EMAs:
TSLA trades above all moving averages, short-term and long-term. Incl. SMA200 and EMA89/55.
» MACD bullish cross:
This is a very strong signal. Last week the MACD produced a bullish cross and is now coming out of the bearish zone. This is bullish for two reasons, the histogram turns green and there is plenty of room available for additional growth. In a way, this signal shows that the bullish wave is only starting now and that it will continue long-term. This MACD signal doesn't show up unless a bullish wave is coming. You can look back at the weekly MACD and confirms this for yourself. Each time the b-cross is in, this stock grows for months.
» RSI bullish zone (57.63):
To be honest, I don't like how the RSI is looking but we have the classic higher highs and higher lows pattern. The reading is bullish and shows plenty of room available for growth. It could be better though but still, leaning up and supporting more up.
» RENKO (weekly):
Clearly bullish. This confirms TSLA is in an uptrend now and will keep going higher.
» RENKO (daily):
In the daily RENKO chart the bullish bias/signal is even more pronounced, meaning, no room for doubts.
» To end this 'it is obvious Tesla will continue rising technical analysis', let's consider the monthly timeframe:
— We have a perfect rising channel.
— There is a rounded bottom (orange) which is a reversal signal.
— There is a hammer candlestick last month which is also a reversal signal.
— This month is full green which confirms both the hammer and rounded bottom as reversal signals.
All these signals are saying that the bullish trend will continue now.
Last month produced the highest volume since June 2023.
» Tesla (TSLA) is going up.
Namaste.

Never bet against Elon?Never betting against the man is a pretty solid strategy. Nevertheless, considering I am long shares I want to take this textbook trade to hedge (again).
This morning on my spike alerts list was $NASDAQ:TSLA. With an opening high of 354.56 which swiftly closed back inside the range a 30m spike was created. The ATR Clearance fits my criteria to consider this a valid spike to play.
Add to this the context of the Daily. NASDAQ:TSLA is riding the 50% of the big move down on the Daily at 351.39. The spike combined with the Resistance makes this a "have to take" trade.
Playing this with July 300P Options.

CATL’s HK Debut IGNITES EV Revolution Tesla’s Secret Weapon?🔥 CATL’s HK Debut IGNITES EV Revolution Tesla’s Secret Weapon?
BOOM! Chinese battery king CATL ($CATL.HK) just skyrocketed in its Hong Kong debut, defying Pentagon blacklists. Powering Tesla, VW, and Mercedes, it’s the EV supply chain’s 800-lb gorilla. Funds are pouring in for global domination miss this, and you’re sidelined!
⚡️ Pro Tip: EV stocks are heating up, but US-China tensions could crash the party. Watch NYSE:NIO , NASDAQ:LI too!
🚀 Share this if you’re bullish on EVs! What’s your top EV pick?

$TSLA on my top watch. Loaded flag?Tesla doing NASDAQ:TSLA things. This moved so sluggish and slow and I guess it was forming and waiting to set something up. If everything else goes smooth tomorrow, I’m looking for a Tesla’s to break out of this bull flag to the upside and retest that 350 range again and hopefully eventually break up to the upside.
I already have calls that I’m swinging but that’s for June 6. Long calls. Wait for your set up. Do your due diligence. Let me know what you think!

Tesla (TSLA) – From EV Giant to Tech & Energy Ecosystem Titan Update Summary:
Tesla NASDAQ:TSLA continues its transformation beyond vehicles, building a vertically integrated platform across mobility, energy, AI, and infrastructure. We maintain a bullish stance above $270.00–$275.00, with an upside target of $470.00–$480.00 based on multi-revenue stream expansion and high-margin software/service potential.
🧩 Key Growth Catalysts:
🔌 Supercharger Network Monetization
Now open to non-Tesla EVs, creating a recurring infrastructure revenue stream
Margins likely higher than vehicle hardware—similar to SaaS economics at scale
Reinforces Tesla’s ecosystem lock-in and increases brand leverage
🤖 Robo-Taxi & FSD Platform
Robo-taxi launch expected in late 2025/2026 could redefine Tesla as a Mobility-as-a-Service (MaaS) provider
Software-like margins from Full Self-Driving (FSD) subscriptions and usage fees
Establishes a powerful network effects moat
🔋 Energy + AI Synergies
Growth in Powerwall, Megapack, and solar deployments
Custom AI chips powering FSD could open new B2B licensing opportunities
AI + energy + hardware = long-term defensibility and scalability
🌍 Macro Support:
Global EV penetration projected to exceed 45% by 2030
U.S. and EU incentive tailwinds + rising fuel costs accelerate EV demand
Rising demand for grid-scale energy storage bolsters Tesla Energy segment
📈 Trade Setup & Price Targets:
✅ Entry Zone: $270.00–$275.00
🎯 Target Range: $470.00–$480.00
⏳ Time Horizon: 6–12 months (event-driven upside with robo-taxi and earnings catalysts)
🧠 Investment Thesis Summary:
Tesla is no longer just an automaker. It’s an ecosystem-first, AI-powered energy and tech company building infrastructure, platforms, and software at scale. The convergence of hardware, energy storage, and autonomy makes TSLA a rare multi-vector growth story with a durable long-term edge.
#Tesla #TSLA #EV #FSD #MobilityAsAService #EnergyStorage #TechEcosystem #BullishBreakout

TESLA Under Pressure! SELL!
My dear followers,
This is my opinion on the TESLA next move:
The asset is approaching an important pivot point 349.84
Bias - Bearish
Safe Stop Loss - 369.27
Technical Indicators: Supper Trend generates a clear short signal while Pivot Point HL is currently determining the overall Bearish trend of the market.
Goal - 312.75
About Used Indicators:
For more efficient signals, super-trend is used in combination with other indicators like Pivot Points.
Disclosure: I am part of Trade Nation's Influencer program and receive a monthly fee for using their TradingView charts in my analysis.
———————————
WISH YOU ALL LUCK

Tesla Stock Soars 60% in 4-Week Winning Streak. Should You Buy?With global trade tensions easing and the outlook clearing up a bit, especially with next month’s robotaxi launch, Tesla bulls are jumping right in to buy the dip and ride out a four-week rally. Is there more to that? Let’s find out.
Tesla NASDAQ:TSLA just pulled off a move most gym bros would call “bulking season.”
The stock is up 60% over the past month. That’s not a typo — it’s a full-on, pedal-to-the-metal rally that’s left shorts scrambling and bulls fist-pumping like it’s 2020 again.
In just four weeks, Elon Musk’s EV maker ripped higher with the kind of velocity typically reserved for SpaceX rockets or Dogecoin bonanzas.
But now that we’re at cruising altitude (and even dipped a little bit again first thing on Monday), the obvious question floats in: Should you still be buying this? Or is this just another one of the speculative dopamine-driven dead-cat bounces?
Let’s plug in, charge up, and break it down.
💡 From Earnings Letdown to Elon Euphoria
The move started innocently enough — with bad earnings. The first-quarter report disappointed Wall Street — revenue came in light. Margins shrank. Deliveries were meh. (Mandatory “keep an eye on the earnings calendar ” remark!) Most companies would’ve been punished after such a showing.
But Tesla is not like most companies.
Instead of spiraling, shares soared 18% the week after the report — because, surprise, Tesla said it will stick to its promises. The company reiterated plans for a lower-priced EV (a Tesla for the masses), and doubled down on its robotaxi rollout, the Cybercab, slated to launch in Austin, Texas, this June.
Cue the retail stampede.
Investors didn’t see a company in trouble. They saw a growth story still in motion, with enough Muskian magic to keep hope (and valuations) alive. Tesla didn’t need to crush numbers — it just had to convince traders it hadn’t stalled out.
Mission accomplished.
🤙 Macro Tailwinds and China’s “Chill Pill”
Tesla didn’t rally in a vacuum (though that sounds like an Elon side project). The broader market has been in risk-on mode lately , helped by:
Easing China–US trade tensions , which is great news for Tesla’s Shanghai Gigafactory and its global supply chain.
A less hawkish Fed narrative against the backdrop of cooling inflation , making growth stocks slightly less allergic to rising rates.
Renewed optimism around AI and automation, both of which Tesla has front-row seats to.
Tesla benefits from all of these themes. It’s not just a car company — it’s a tangled web of EVs, robotics, self-driving tech, and Elon’s very public moonshots. When macro winds are favorable, Tesla catches more than its fair share of breeze.
📊 Technically Speaking: Breakouts and Burnouts
From a chart perspective, the move has been textbook FOMO.
Tesla sliced through its 50-day, 100-day and 200-day moving averages like butter. Volume popped. Momentum soared. And it finally reclaimed the $300-350 zone that acted like a gravitational sinkhole for months. In other words, Tesla is back above the $1 trillion valuation handle.
Is there a flipside, though? The chart’s showing signs of overextension. RSI is flirting with overbought territory. Momentum is hot — but not sustainable forever.
That doesn’t mean you short it. It just means don’t chase it like it’s a Black Friday deal on dual monitor setup.
🔎 Valuation? Let’s (Not) Talk About That
Oh right, valuation. That inconvenient little thing.
Tesla is still trading at eye-watering multiples. Forward price-to-earnings (P/E) ratio? North of 170. Tesla’s profits peaked in 2022 and have since been tumbling. But who cares — compared to traditional automakers, Tesla is operating on a completely different planet.
Analysts are eyeballing earnings per share for 2025 to land at $3.30. Even if markets were to slap a 50x forward P/E ratio, it would give Tesla a valuation of $165 a share and still be at a premium.
And to be fair, bulls will say that’s exactly the point. Tesla isn’t a car company. It’s an AI platform with a vision for the future. An energy business. A robotaxi empire-in-waiting. Maybe even a sentient Mars colony someday.
So… the price doesn’t have to make sense — if you buy the vision.
But if you’re looking for fundamentals, well, they’re still catching up.
🚗 The Robotaxi Wildcard
Let’s talk robotaxis.
Tesla’s robotaxi launch next month could be a game-changer — or a meme. If it works, and the Cybercab is a success, even in a limited beta, it will validate one of Elon’s long-promised, never-quite-delivered moonshots . It opens the door to software revenue, recurring cash flows, and the holy grail of auto tech: mobility-as-a-service.
If it flops? Well, it won’t be the first time. But this time, the market has already priced in success.
That’s risky.
🧐 Should You Be Buying?
No one ever went broke taking profits. And if you rode this 60% move, pat yourself on the back and consider trimming. It doesn’t make you a bad long-term investor. It makes you a responsible one.
If you missed it? Don’t FOMO in at the top (but also — who’s to say that’s the top?). Tesla’s chart has looked like this before — only to collapse in a pile of overhyped press releases and supply chain “hiccups.” But if you see a pullback or at least some consolidation? Great trades are about patience, not hot takes.
❤️ Bottom Line
Tesla’s four-week tear is impressive. It’s got narrative fuel, technical follow-through, and macro support. But that doesn’t mean it’s an all-you-can-eat rally buffet.
Tesla is still a volatile beast with sky-high expectations and a CEO who can tank the stock with a tweet or an Oval Office speech. It’s also a company that might reinvent urban transport next quarter.
So what’s the play? Are you ramping up your long bets on the volatile EV stock or you're more of a waiting-for-the-pullback trader? Share your thoughts in the comments!

TSLA bulls - Do You Have More?Tesla has had a stunning rebound , the chart has gone vertical right into a key resistance.
It's amazing how price action can respect key Fibonacci levels.
A 50% retrace can be observed on this chart. We all now Tesla can move in parabolic fashion but typically when it does tbag it's prone to large drawdown.
Ideally bulls would want to see price trade sideways to lower form here in setting up the potential for the next leg to $380
If price moves to quickly through this 50% Fib level expect a large reversal down.
I personally wouldn't buy up here as the bullish inverse head and shoulders from it's lower base has achieved its upside.
We need a new pattern to form and right now we haven't established a new bull flag of pattern of consolidation. NASDAQ:TSLA

Tesla Inc. Stocks & Crypto: We Are All One!What one does, the rest follows.
Tesla (TSLA) hit bottom in January 2023. It has been moving within a rising channel, higher highs and higher lows since.
Volume was moving down until December 2024. The drop in volume was the preparation for a correction. Volume has been rising and 7-April 2025 produced the highest volume since February 2023.
Here is the thing, when the highest buying came in February 2023, it was the start of this major bullish dynamic, the rising channel. Now volume starts to rise again after a major low (a higher low by the way). This means that we are set to experience another phase of growth, reaching new highs compared to December 2024 and in December TSLA produced its All-Time High. This means that the current bullish wave, brand new, will end in a new ATH in a matter of months. Isn't that great?
Knowing that Tesla is growing and set to continue growing, we know that all related markets or those that have a positive correlation with this one will also grow; What one does, the rest follows.
Thanks a lot for your continued support.
Namaste.

$TSLA Weekly Chart Analysis🚀 NASDAQ:TSLA Weekly Chart Analysis
🔹 Strong Momentum: Launching off the volume shelf and cruising with the market’s bullish energy.
🔹 Room to Run: Approaching the red barrier, but not there yet—still has upside before a pullback.
🔹 Healthy RSI: Sitting at 56.60, meaning plenty of room for further gains.
🔹 Catalyst Ahead: Robotaxi event incoming! (Sell the news? You bought the rumor. 🤔)
🔹 Key Resistance: Watch levels at $350–$400.
Stay sharp—let’s see if TSLA keeps charging forward! ⚡📈

AAPL LOOKING BULLISH 14TH MAY 2025Aapl is looking good to go long at current price as every demand is being respected and price is looking to go deeper into tbe supply zone.
So I will be going long with STOCKS ONLY.
If you any doubts do let me know in the comments below
