Did Redditors make any money on TSLA?I thought I read that NASDAQ:TSLA was going down and Elon was going broke. Earnings were going to assure it. Looks like it came and went and instead went bullish. Oh well, you can't rely on narratives: Only Technicals!
The 218.65 Volume Profile Level has been holding TSLA up for weeks now. Great long by the way. And as long as it holds the next major VP level would be 183.63.
Now though TSLA is caught in a range and this does seem to be the top. If haters had just waited for a signal instead of trading on emotions they could have played this short from a higher price and with Earnings IV crush already over.
Tesla

TSLA: Low Is In , Rally IncomingTSLA is showing signs of strong accumulation, with buyers consistently stepping in and volume expanding on up-moves. Price structure is improving, breakouts further confirm strength, increasing the likelihood that bears have been left behind. Based on the price action and volume alone, TSLA looks ready for a potential sustained move higher.

TESLA: Short Trade Explained
TESLA
- Classic bearish formation
- Our team expects pullback
SUGGESTED TRADE:
Swing Trade
Short TESLA
Entry - 284.90
Sl - 298.09
Tp - 256.85
Our Risk - 1%
Start protection of your profits from lower levels
Disclosure: I am part of Trade Nation's Influencer program and receive a monthly fee for using their TradingView charts in my analysis.
❤️ Please, support our work with like & comment! ❤️

𝗧𝗲𝘀𝗹𝗮 𝗕𝗿𝗲𝗮𝗱𝗸𝗼𝘄𝗻: Priced for perfectionPriced for perfection in an imperfect market
NASDAQ:TSLA nearly hit its 200dma and key resistance area (~288–292) after a roughly 20% post-earnings squeeze, and as long as it stays below that level, it risks retesting the long-term uptrend line that has marked major lows twice since COVID.
𝘛𝘢𝘳𝘪𝘧𝘧 𝘢𝘯𝘥 𝘴𝘶𝘱𝘱𝘭𝘺-𝘤𝘩𝘢𝘪𝘯 𝘳𝘪𝘴𝘬: Tesla depends heavily on Chinese-made battery and electronic components now hit by reciprocal U.S. tariffs, while over 60% of global neodymium and dysprosium—vital for its EV motors—are mined and processed only in China, creating a critical bottleneck that could sharply elevate its input costs.
𝘔𝘢𝘳𝘨𝘪𝘯 𝘱𝘳𝘦𝘴𝘴𝘶𝘳𝘦 𝘷𝘴. 𝘭𝘰𝘧𝘵𝘺 𝘷𝘢𝘭𝘶𝘢𝘵𝘪𝘰𝘯: Q1 price cuts of up to 20% on core models drove Tesla’s auto gross margin to its lowest since 2020, calling into question the sustainability of its >70× forward P/E multiple, which assumes exceptionally high profits from future ventures like robotics and autonomous fleets.
$NQ_F NASDAQ:NDX NASDAQ:QQQ NASDAQ:AMZN NASDAQ:META NASDAQ:NVDA NASDAQ:SOX $ES_F AMEX:SPY SP:SPX TVC:DXY NASDAQ:TLT TVC:TNX TVC:VIX #Stocks #TrumpTariffs 🇺🇸 #ChinaTariffs 🇨🇳

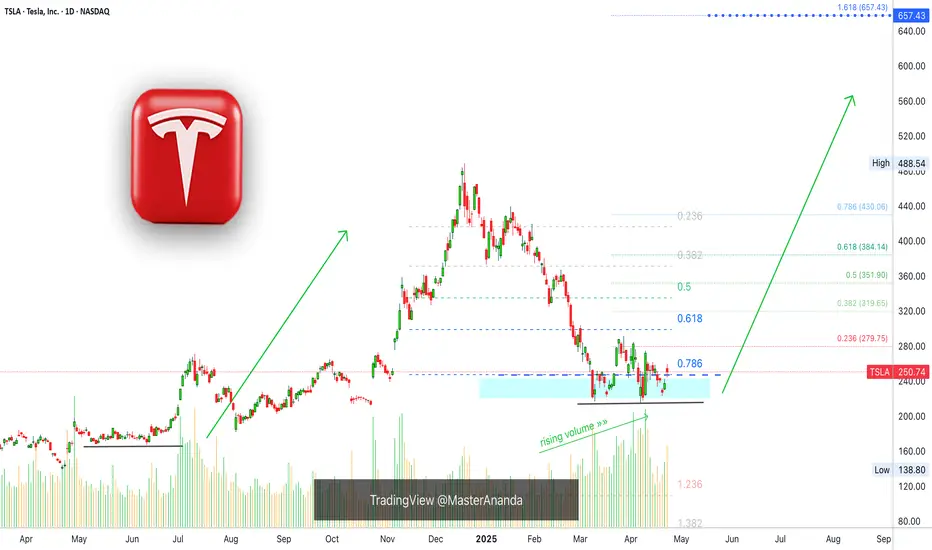
Tesla Finds Support, 657 Next Easy High & All-Time HighTesla is looking pretty good right now, support has been found. The correction amounted to -55.5%. It started in mid December 2024 and the first low was hit in March 2025.
Since March TSLA has been in the process of forming a bottom.
The action moved below 0.786 Fib. retracement level in relation to the last bullish wave. The action is back above this level now and this is pretty good. As long as the action happens above the magic blue dashed line, Tesla is good and set to grow.
This signal, perfect symmetry, is supported by rising volume.
Buy volume is rising massively as TSLA moves into a long-term support zone.
(Smart people, smart money and smart traders buy when prices are low —this volume signal reveals the highest buying in years as TSLA hits support.)
The most revealing fact from a logical standpoint is the size of the correction, a 55% correction is a lot by any standard. When a market goes through such a strong correction, it tends to reverse and produce next a new move. It moves in waves. It goes up and down, up and down. We are seeing the end of the down-move and this will automatically lead to an up-wave.
When the bottom was hit, last month, the action goes flat. Tesla was clearly moving lower but as support was found the bottom stays flat. This is another revealing signal for the logical mind. No longer a downtrend but a consolidation phase, which is part of a transition period.
» So the market was bullish and from bullish turned bearish, from bearish it went sideways and from sideways it will grow.
This is an easy buy.
Thanks a lot for your comment and continued support.
Namaste.
Tesla: At a Crossroads – Accumulation or Breakdown?One of the most talked-about stocks right now — Tesla NASDAQ:TSLA . And for good reason. Between the constant media buzz around Elon Musk and the recent surge in vandalism against Tesla vehicles, it’s been getting plenty of attention. But I’m not here to talk politics or headlines — I’m here for the chart.
And honestly? It’s looking better than you’d think. Despite all the noise, price has held steady in the $225 to $270 range, showing signs of a sideways accumulation phase — right at the Point of Control (POC) since 2021. That’s a pretty strong area, technically speaking.
Over the next few weeks, we’re likely to get clarity:
Either we break above $350, which opens up serious upside potential,
Or we break down toward the Volume Area Low — specifically the 2024 VAL at $161.18.
The real danger zone? Below $138. If price breaks that level, we have to assume that Wave 2 isn’t done yet — even though it was originally considered complete in 2023.
Until then, the structure actually looks constructive: we’ve been putting in higher lows and higher highs since 2023, which signals a potential uptrend.
How far that uptrend goes is hard to call. But if we break and hold above $325, then a pullback toward $300–$270 could offer a clean entry opportunity.
On the flip side, yes — if the market collapses and Wave II is still unfolding, we could be staring at $175, $125, or even as low as $75–$50 in an extreme scenario. And that would be wild for a stock that once touched $485.
But that’s why it’s crucial to zoom out. Ask yourself:
What do I want from Tesla — long-term conviction or short-term plays?
Then build your view. If the macro fits, dial into the lower time frames to find your edge. The setup is building — and it’s looking like Tesla is prepping for a big move.
Question is: which direction are you positioned for?

Tesla - This Is Actually Not Gambling!Tesla ( NASDAQ:TSLA ) still looks quite bullish:
Click chart above to see the detailed analysis👆🏻
Just a couple of weeks ago I published a bunch of analysis, explaining all the reasons for a potential -40% drop on Tesla. However on the higher timeframe, Tesla still looks quite strong and with the bullish break and retest playing out so far, we could even see new all time highs soon.
Levels to watch: $260, $400
Keep your long term vision,
Philip (BasicTrading)

Tesla Suspends Guidance: Why Its Forecasts Were Often WrongTesla Pulls the Plug on Guidance: Why Its Forecasts Weren't Worth Much Anyway
Tesla, the electric vehicle behemoth that has captivated and often confounded investors for over a decade, has made another move guaranteed to stir debate: it's suspending its forward-looking guidance. For many companies, withdrawing financial forecasts signals significant uncertainty or a major strategic shift, often sending shares tumbling. While Tesla's stock undoubtedly reacts to such news, a deeper look reveals a compelling argument: Tesla's official guidance, particularly in recent years, had become such a moving target, so frequently untethered from eventual reality, that its predictive value was already deeply questionable. Suspending it might simply be acknowledging the obvious.
For years, Tesla's earnings calls and investor communications were punctuated by ambitious, often audacious, targets set by CEO Elon Musk and the company. These weren't just vague aspirations; they were often specific numbers for vehicle deliveries, production ramps, timelines for new technologies like Full Self-Driving (FSD), and launch dates for anticipated models like the Cybertruck or the Semi. The market, enthralled by Tesla's disruptive potential and Musk's charismatic pronouncements, frequently hung on these words, baking them into valuation models and trading strategies.
However, the history of Tesla meeting these self-imposed targets is, charitably speaking, inconsistent. The guidance often veered into the quixotic, reflecting a potent blend of extreme optimism, engineering ambition, and perhaps a dash of Musk's famed "reality distortion field."
Consider the infamous "production hell" of the Model 3 ramp-up. Initial targets were wildly optimistic, projecting volumes that the company struggled immensely to achieve, facing bottlenecks in battery production and assembly line automation. While Tesla eventually overcame these hurdles, the timeline and cost deviated significantly from early guidance. Similarly, the promise of Full Self-Driving has been a perennial "next year" phenomenon. While the capabilities of Tesla's Autopilot and FSD Beta have advanced significantly, the arrival of true Level 4 or 5 autonomy, capable of operating without driver supervision under virtually all conditions – as often implied by the timelines suggested in guidance – remains elusive, years behind schedules hinted at in past forecasts.
The Cybertruck provides another stark example. Unveiled in 2019 with a projected start date that came and went multiple times, its eventual, limited launch in late 2023 was years behind schedule, and scaling its unique manufacturing process remains a challenge. Guidance around its ramp-up has been adjusted repeatedly.
This pattern isn't necessarily born from deliberate deception, but rather from a confluence of factors inherent to Tesla's DNA and the volatile industries it operates in:
1. Aggressive Goal Setting: Musk is known for setting incredibly ambitious "stretch goals" intended to motivate teams to achieve breakthroughs. While effective internally, translating these aspirational targets directly into public financial guidance is fraught with risk.
2. Underestimation of Complexity: Bringing revolutionary products to mass market – whether it's a new vehicle platform, a complex software suite like FSD, or novel battery technology – involves navigating unforeseen engineering, manufacturing, supply chain, and regulatory hurdles. Initial guidance often seemed to underestimate these complexities.
3. Market Volatility: The EV market itself is dynamic. Consumer demand shifts, government incentives change, raw material costs fluctuate, and competition intensifies – all factors that can derail even well-laid plans and render guidance obsolete.
4. The "Musk Factor": Elon Musk's public statements, sometimes made spontaneously on social media or during earnings calls, often became de facto guidance, even if not formally enshrined. His optimism could inflate expectations beyond what the operational side of the business could reliably deliver on a set schedule.
Given this history, why did the market continue to pay such close attention? Part of it was the sheer scale of Tesla's ambition and its undeniable success in revolutionizing the automotive industry. Investors betting on disruption were often willing to overlook missed targets, focusing instead on the long-term vision. Past stock performance also created a feedback loop; as the stock soared despite missed guidance, it reinforced the idea that the specific numbers mattered less than the overall trajectory and narrative. Guidance served as a signal of intent and ambition, even if the execution timeline slipped.
However, the context has shifted dramatically. Tesla is no longer the lone wolf in a nascent EV market. Competition is fierce, particularly from Chinese automakers like BYD, but also from legacy manufacturers finally hitting their stride with compelling EV offerings. Global EV demand growth, while still present, has slowed from its previously exponential pace. Tesla itself has engaged in significant price cuts globally to maintain volume, putting pressure on its once-stellar automotive margins.
In this more challenging environment, the luxury of consistently missing ambitious targets wears thin. The decision to suspend guidance now can be interpreted in several ways:
• Pragmatic Realism: Management may genuinely lack visibility into near-term demand, production capabilities (especially with new models or processes), or the impact of macroeconomic factors. Suspending guidance is arguably more responsible than issuing forecasts they have low confidence in.
• Strategic Pivot: Tesla is increasingly emphasizing its future potential in AI, robotics (Optimus), and autonomous ride-sharing (Robotaxi). These ventures have even longer and more uncertain development timelines than vehicle production. Focusing investor attention away from quarterly delivery numbers might be part of a strategy to reframe the company's narrative around these future bets.
• Avoiding Accountability: A more cynical take is that suspending guidance removes a key benchmark against which management's performance can be judged, particularly during a period of slowing growth and heightened competition.
Regardless of the primary motivation, the practical implication for investors is clear: the already thin reed of Tesla's official guidance is now gone entirely. This forces a greater reliance on analyzing tangible results – actual deliveries, reported margins, cash flow generation, progress on FSD adoption rates, and demonstrable advancements in new ventures – rather than promises of future performance.
The suspension underscores that investing in Tesla requires a strong belief in its long-term vision and its ability to execute on extremely complex technological and manufacturing challenges, often without a clear, company-provided roadmap for the immediate future. The focus must shift from parsing guidance to meticulously evaluating performance, competitive positioning, and the plausibility of its next-generation bets.
In conclusion, Tesla's decision to stop issuing formal guidance is less of a shockwave and more of a formal acknowledgment of a long-standing reality. Its forecasts were often more aspirational than operational, reflecting a culture of ambitious goal-setting within a highly volatile industry. While the absence of guidance introduces a new layer of uncertainty, savvy investors likely already applied a significant discount factor to Tesla's projections. The company's future success now hinges more transparently than ever not on what it promises for tomorrow, but on what it demonstrably delivers today. The quixotic forecasts may be gone, but the fundamental challenge of execution remains.

TESLA 22 APRIL 2025This is my analysis for Tesla irrespective of its earnings. If yoiu have any doubts feel free to leave a txt.
I am long with proper RR & risk management

Daily Price Action: Tesla TSLA Tuesday 4/22/2025In this video, we will be looking into the potential price action of TSLA.

TESLA: Expecting Bullish Continuation! Here is Why:
The analysis of the TESLA chart clearly shows us that the pair is finally about to go up due to the rising pressure from the buyers.
❤️ Please, support our work with like & comment! ❤️

TSLA Weekly Options Trade Plan 2025-04-17TSLA Weekly Analysis Summary (2025-04-17)
Below is an integrated analysis of the reports and market data:
──────────────────────────────
MODEL REPORTS – KEY POINTS
• Grok/xAI – Price and moving averages on both 5‑min and daily charts are below key EMAs; RSI and MACD point to current bearish momentum. – Notable technical support at about 239.75 with resistance above near 242. – The options chain shows heavy put activity at the $240 strike (premium about 0.67), and max pain is at 245, although that level is less relevant for a near‐term (0DTE) trade. – Recommendation: Trade the TSLA $240 PUT at an ask of 0.67 at the open, aiming for roughly a 100% gain and using about a 50% loss as a stop.
• Gemini/Google – Technicals on short‐term and daily timeframes are mixed: the daily chart is clearly bearish while some 5‑min indicators hint at stabilization. – Conflicting signals (including the max pain pull toward 245 and falling VIX) result in not having a high‑conviction directional bias. – Conclusion: “No trade” is recommended today because the conflicting indicators raise the risk of getting whipsawed.
• Claude/Anthropic – Technical analysis on both 5‑min and daily confirms a moderately bearish bias (price well below major EMAs, RSI below 50). – However, one suggested trade was a TSLA $237.50 PUT at an extremely low premium (0.13) which seems less attractive given the preferred premium range. – In essence, the model sees downside potential but selected a strike a bit further out from the current price.
• Llama/Meta – A moderately bearish setup is noted, with the technical picture similar to the others on very short‐term charts. – However, the model also flags the influence of max pain at 245 and concludes that a naked call (for example, at the $240 or $242.50 strike) could profit if the upward “max pain pull” works in play. – Ultimately, this view contrasts with the put trades favored by others.
• DeepSeek – Confirms the overall technical picture: price is below key averages, with bearish momentum evident on both 5‑min and daily charts. – Emphasizes the high open interest on $240 puts and the near-term support at 239.75. – Recommends buying the TSLA $240 PUT at its 0.67 ask price for this weekly (0DTE) option. ────────────────────────────── 2. AREAS OF AGREEMENT AND DISAGREEMENT
Agreements: – Most reports note that TSLA is trading in a moderately bearish state with price below the relevant moving averages and key support levels near 239.75. – There is broad recognition that options activity is concentrated around the $240 strike—especially on the put side, where volume and open interest are very high, underscoring bearish positioning. – Technical indicators (RSI, MACD, Bollinger Bands) on short‑term and daily charts lean toward bearishness despite some very short‑term signals of stabilization.
Disagreements: – Gemini/Google sees too many conflicting signals (including the upward pull implied by max pain) and hence recommends no trade, while the majority of the other analysts view the setup as tradeable. – Llama/Meta is open to trading a naked call (capitalizing on the max pain influence) whereas Grok/xAI, DeepSeek, and to a lesser degree Claude/Anthropic advocate for a bearish put trade instead. ────────────────────────────── 3. CONCLUSION & TRADE RECOMMENDATION
Overall Market Direction Consensus: Most opinions point to a moderately bearish bias for TSLA on a near-term, 0DTE weekly horizon. Even though conflicting signals (like max pain toward 245 and some stabilization on very short timeframes) introduce uncertainty, the weight of the technicals and put side open interest lean toward downside pressure.
Recommended Trade: Trade a single‑leg, naked PUT (weekly option) on TSLA.
Trade Parameters: – Instrument: TSLA – Strategy: Buy a TSLA $240 PUT – Expiration: 2025‑04‑17 (weekly, 0DTE) – Premium: Approximately $0.67 per contract (slightly above the preferred range, but justified by high liquidity and clear technical support) – Entry Timing: At the open – Profit Target: Around 100% gain from the entry premium (i.e. exit near a $1.34 premium) – Stop‑Loss: Roughly a 50% loss at about $0.33 per contract – Confidence Level: Approximately 65% – Key Risks & Considerations: • The mixed signals (especially Gemini’s caution and the max pain theory) mean price could quickly reverse if TSLA rebounds near 245. • Very short‑term trading (0DTE) carries risks related to rapid time decay and volatility spikes. • A failure to break important support (around 239.75) would warrant an early exit. ────────────────────────────── 4. TRADE_DETAILS (JSON Format)
{ "instrument": "TSLA", "direction": "put", "strike": 240.0, "expiry": "2025-04-17", "confidence": 0.65, "profit_target": 1.34, "stop_loss": 0.33, "size": 1, "entry_price": 0.67, "entry_timing": "open" }
Disclaimer: This newsletter is not trading or investment advice but for general informational purposes only. This newsletter represents my personal opinions based on proprietary research which I am sharing publicly as my personal blog. Futures, stocks, and options trading of any kind involves a lot of risk. No guarantee of any profit whatsoever is made. In fact, you may lose everything you have. So be very careful. I guarantee no profit whatsoever, You assume the entire cost and risk of any trading or investing activities you choose to undertake. You are solely responsible for making your own investment decisions. Owners/authors of this newsletter, its representatives, its principals, its moderators, and its members, are NOT registered as securities broker-dealers or investment advisors either with the U.S. Securities and Exchange Commission, CFTC, or with any other securities/regulatory authority. Consult with a registered investment advisor, broker-dealer, and/or financial advisor. By reading and using this newsletter or any of my publications, you are agreeing to these terms. Any screenshots used here are courtesy of TradingView. I am just an end user with no affiliations with them. Information and quotes shared in this blog can be 100% wrong. Markets are risky and can go to 0 at any time. Furthermore, you will not share or copy any content in this blog as it is the authors' IP. By reading this blog, you accept these terms of conditions and acknowledge I am sharing this blog as my personal trading journal, nothing more.

TESLA | Monthly Analysis After NASDAQ:TSLA hitting its ATH target, 87% - 90% retracement is next target
start of 2027 = will be a buying signal for tesla unless there's some issues involving with Elon Musk, then tesla could experience under performance
Long term investors - prepare for down side inside buying channel

TESLA | Weekly HTF TargetAfter having a deep retracement ~70% tesla looks ready to reach Higher Highs...
New High target: $490+

TSLA - Double Top To Stronger Trend LineA long term trend line going to be tested as a result of a large double top forming
I expect price to rebound very strongly from this long term green trend line
Short - mid term bearish
Long term very bullish
Weekly timeframe

Tesla Long Longseems like we are done with those lower prices; this week´s target is $305.
as you can see the SL and TP
GL

Tesla Shares Tumble 7%+ Following Cybertruck Quality ComplaintsTesla Inc. (NASDAQ: NASDAQ:TSLA ) faced another sharp sell-off on Thursday 10th. The stock dropped 7.27% to close at $252.40, down $19.80 for the day. However, volume was high, reaching 399.04 million shares.
The fall followed reports of build quality issues in Tesla’s Cybertruck. Owners posted complaints on the Cybertruck Owners Club forum. Several noted that the vehicle’s metal panels had detached.
Additionally, videos showing Cybertruck damage in cold weather gained attention on social media site X. These reports raised concerns over production quality.
Tesla had been recovering before the recent plunge. However, concerns about product reliability appear to have paused the rebound.
Technical Analysis
The 3-day chart shows Tesla in a strong downtrend. The stock broke below $290, triggering a drop to around $220 before bouncing back to $252. Price recently respected a key support near $190m, which may act as a floor for future declines. High volume near support signals buyer interest. If Tesla breaks above $290, it could retest $300. That zone acts as resistance and aligns with the 50- and 100-day moving averages at $252 and $232, respectively.
The longer-term target is near $488, but the price must clear $290 first. A failure to hold support near $220 could send the stock back toward $180. The RSI is at 42.77, slightly above oversold. Momentum is weak but may shift if price builds support above $250. Tesla’s next move depends on how it manages both technical resistance and consumer concerns.

Tesla (TSLA) Shares Jump Approximately 22% in a Single DayTesla (TSLA) Shares Jump Approximately 22% in a Single Day
Tesla was among the standout performers in the stock market rally that followed President Trump’s decision to delay, by 90 days, the implementation of new international trade tariffs — with the notable exception of China. According to the charts, Tesla (TSLA) shares surged by approximately 22%.
Why Did TSLA Shares Soar?
Some insight comes from Cathie Wood, CEO of asset management firm ARK Invest.
In an interview with Barron’s on Wednesday, she noted the following:
→ Tesla plans to launch a new, more affordable vehicle this quarter, likely priced at around $30,000 — roughly half the cost of the base Model Y.
→ The upcoming release of Tesla’s robotaxi service could also lower the need for large upfront vehicle purchases, offering consumers a more economical alternative.
→ Tesla sources more components from North America than most other US carmakers, meaning it is less exposed to tariff-related costs.
And there’s another reason TSLA may have jumped — one that can be found in the chart.
Technical Analysis of TSLA
Take note: the March and April lows (marked with arrows) are both around the $220 level. Meanwhile, the S&P 500 (US SPX 500 mini on FXOpen) posted a significantly lower low in April compared to March. This suggests that, in early April, TSLA was outperforming the broader market. Why?
One possible explanation is that there has been — and perhaps still is — a strong accumulation interest in TSLA. Buyers may have been quietly scooping up available shares amid recession fears. When yesterday’s news suddenly shifted market sentiment, the “spring” uncoiled, catapulting TSLA’s share price upward.
However, the overall downtrend remains intact. If bullish momentum continues, the price may encounter resistance around the psychologically significant $300 level — which coincides with the upper boundary of the downward channel.
This article represents the opinion of the Companies operating under the FXOpen brand only. It is not to be construed as an offer, solicitation, or recommendation with respect to products and services provided by the Companies operating under the FXOpen brand, nor is it to be considered financial advice.

Tesla Taps the Golden Zone – Is the Launch Sequence Engaged?Tesla (TSLA) has shown textbook precision by respecting the golden zone after a significant sweep of previous highs. Rather than violating the last HTF low—which would’ve hinted at deeper downside—price instead retraced cleanly into the OTE (Optimal Trade Entry) range and reacted with strong bullish intent.
This move indicates a healthy retracement rather than weakness, suggesting a continuation to the upside. Confirmation of this potential bullish leg would be a sustained close above the 272–300 level, which aligns with previous buyside liquidity zones and Fibonacci confluence.
Key Observations:
- Golden Zone respected: Price bounced cleanly between the 62–79% fib levels.
- HTF low protected: No violation of higher timeframe bullish structure.
- Volume spike supports the reversal move.
Targets:
- Short-term: 300.61
- Mid-term: 416.67
- Long-term swing: 861.17 (over 255% potential gain)
Conclusion:
Tesla looks set for lift-off 🚀. The reaction at the golden zone and the preservation of structure give high confluence for a potential explosive move higher. Wait for confirmation via price continuation and structure integrity.
As always — DYOR (Do Your Own Research).

Most likely to bounce towards 75This may have reached its bottom for now (or more room to go down towards low 40s)... most likely it should bounce to $75 and then collapse to lows. This could go sideways for years with small ups and downs in between.

[TSLA] Bear Market to $15: Musk’s Empire at Risk?Tesla’s market cap now surpasses the combined market cap of all major automobile producers. Elon Musk is undeniably a genius, yet this staggering valuation owes much to a robust bull market and post-COVID hype. If Tesla were valued using the same earnings and revenue multiples as the average automaker, its stock price would hover between $15 and $20 per share.
TECHNICAL ANALYSIS
Tesla’s chart is one of the most striking I’ve ever seen. It reflects a powerful bull market that has completed an Elliott Wave five-wave structure, signaling that a bear market is likely next.
Wave 4 formed a running triangle—a pattern typical in strong trends—and was followed by a short Wave 5, exactly as expected. Running triangles paired with a brief Wave 5 often indicate distribution. Indeed, Tesla’s chart reveals a beautiful four-year distribution phase (2021–2025). During this period, the stock struggled to climb higher due to persistent selling pressure. Strong hands have now offloaded their shares to weaker hands, setting the stage for a bear market.
A triple divergence on the monthly RSI further confirms extreme overbought conditions and reinforces the case for selling. There’s no significant support until the $15–$20 range.
If my prediction of a 2008-style crash in the S&P 500 (see related ideas) holds true, Tesla could bottom out around $15—a level that, intriguingly, aligns with its COVID-era low.
"Bull market geniuses turn into bear market fools."
Elon Musk net worth derives value mostly from Tesla and SpaceX as other companies are illiquid and very speculative.
Current Musk's Tesla stake is worth around $100 billion if the price falls down to $15 it would be worth $6 billion, all other things being equal that alone would put a significant dent in his net worth.
Musk is widely recognized as someone who leverages his Tesla shares and SpaceX to fund other ventures and lifestyle.
It is not clear at what price level his margin calls are and what arrangements he has with banks but if crash of this magnitude happens all his Tesla shares could be wiped out with possible full blown bankruptcy.
I wish him well and hope he does well, but this scenario is not unlikely and interesting to ponder.

More bad days for TESLATesla is about to meet its temporary trandline and probably will continue to close the gap.

TESLA Always Pay YOURSELF! Tsla Stock were you PAID? GOLD Lesson
⭐️I want to go into depth regarding the this topic but it is a long one with PROS & CONS for doing and not doing it.
Every trader must choose what's best for them but you will SEE when I finally get to the write up that MANY OF THE PROS are NOT FINANCIAL but PSYCHOLOGICAL❗️
Another of 🟢SeekingPips🟢 KEY RULES!
⚠️ Always Pay YOURSELF.⚠️
I know some of you chose to HOLD ONTO EVERYTHING and place your STOP at the base of the WEEKLY CANDLE we entered on or the week priors base.
If you did that and it was in your plan GREAT but... if it was NOT that is a TRADING MISTAKE and You need to UPDATE YOUR JOURNAL NOW.
You need to note EVERYTHING. What you wanted to see before your exit, explain why not taking anything was justified to you, were there EARLY exit signals that you did not act on. EVERYTHING.
🟢SeekingPips🟢 ALWAYS SAYS THE BEST TRADING BOOK YOU WILL EVER READ WILL BE YOUR COMPLETE & HONEST TRADING JOURNAL ⚠️
📉When you read it in black amd white you will have YOUR OWN RECORD of your BEST trades and TRADING TRIUMPHS and your WORST TRADES and TRADING ERRORS.📈
✅️ KEEPING an UPTO DATE JOURNAL is STEP ONE.
STUDYING IT IS JUST AS IMPORTANT👍
⭐️🌟⭐️🌟⭐️A sneak peek of the LESSON after will be HOW & WHEN TO ENTER WHEN THE OPEN BAR IS GOING THE OPPOSITE WAY OF YOUR IDEA.👌
🚥Looking at the TESLA CHART ABOVE you will see that we were interested in being a BUYER when the weekly bar was BEARISH (GREEN ARROW) and we started to consider TAKE PROFITS and EXITS when the (RED ARROW) Weekly bar was still BULLISH.🚥
