Tesla -> The Strongest Stock Of AllHello Traders and Investors ,
my name is Philip and today I will provide a free and educational multi-timeframe technical analysis of Tesla💪
After Tesla stock retested the last strong support zone for bulls, the 0.786 fibonacci level at the $100 level, the recent pump over the past couple of months of more than 100% was no surprise at all.
On the weekly timeframe you can see that Tesla stock is still in an overall strong bullish market, there is resistance coming in at the $320 level but until then there is no reason why Tesla stock should start a correction.
Looking at the daily timeframe you can see that Tesla stock is once again creating a new swing high and there was no bearish rejection at the previous resistance at all - therefore I simply do expect another rally of 15% towards the upside to retest the weekly resistance at the $320 zone.
Keep in mind: Don't get caught up in short term moves and always look at the long term picture; building wealth is a marathon and not a quick sprint 📈
Thank you for watching and I will see you tomorrow!
My previous analysis of this asset:
Teslaanalysis

Tesla's stock trend is likely to rise and fallIs Tesla's stock likely to turn bullish into bearish?
This chart shows the weekly candle chart of Tesla's stock over the past two years. The top to bottom golden section of November 2021 is superimposed in the figure. As shown in the figure, Tesla stock has already surpassed the 1.618 position on the golden section in the past two weeks, and is about to challenge the next strong pressure, which is the 1.382 position on the golden section in the figure! Due to factors such as the global consumer downgrade and the imminent launch of Tesla's affordable models, Tesla's stock is likely to turn bullish into bearish! In the future, just use the 1.382 and 1.000 positions of the golden section in the figure as the long short water separation interval operation! Sell high and buy low within the range, and chase up and kill down outside the range!

Tesla's 2000 Cybertruck Production Underway!As you may already know, Tesla has officially commenced the production of 2000 Cybertrucks this year, and we believe this development presents a unique opportunity for traders like yourself.
Tesla has consistently demonstrated its ability to disrupt the automotive industry, and the Cybertruck is no exception. With its futuristic design, cutting-edge features, and impressive performance capabilities, the Cybertruck has garnered immense attention and anticipation from consumers worldwide.
Given Tesla's track record of delivering groundbreaking products, we believe that the production of 2000 Cybertrucks this year will undoubtedly significantly impact the market. As traders, it is essential to stay ahead of the curve and seize opportunities that arise from such developments.
Hence, we encourage you to consider placing Tesla market orders, considering the potential impact of the Cybertruck production. However, we advise approaching this opportunity cautiously, as any investment involves inherent risks. Conducting thorough research, analyzing market trends, and consulting with financial advisors is crucial to making informed trading decisions.
Tesla's market orders for the Cybertruck are expected to surge in demand, especially with the growing interest from individual consumers and commercial buyers. By placing market orders, you can benefit from the potential rise in Tesla's stock value, which has historically responded positively to significant product launches.
To capitalize on this opportunity, I recommend visiting Tesla's official website or contacting your trusted brokerage firm to place your Tesla market orders. Remember to evaluate your investment strategy and risk tolerance before trading carefully.
As always, staying updated with the latest news and developments surrounding Tesla and the automotive industry is essential. By closely monitoring market trends and emerging technologies, you can make informed decisions that align with your trading goals.

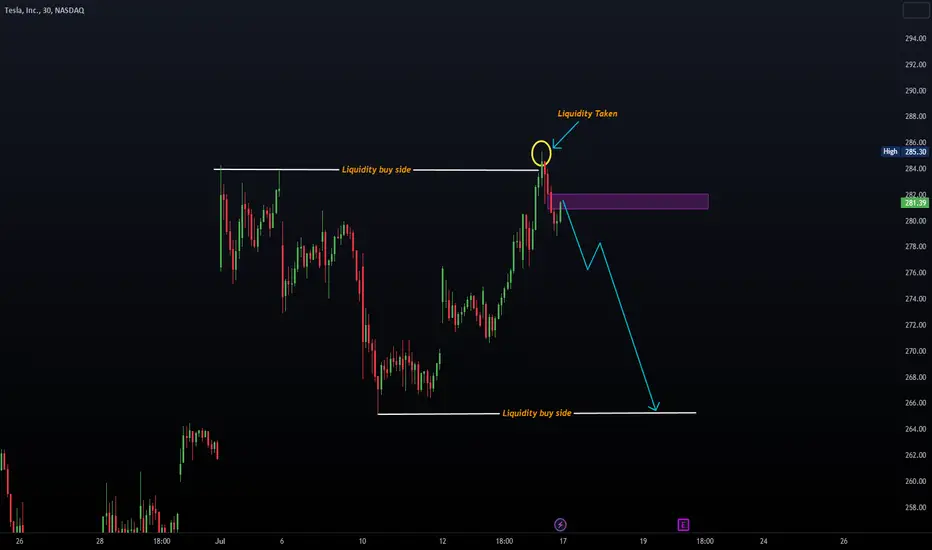
TESLA TRADEAtfer taken liquidity of buyside we will see a distrubution to wards sell side liquidity . FVG '' Fare Value Gap '' can be considered as an entry point .
TSLA Short AnalysisPlanning around the likelihood of a lower high followed by a lower low.
Position will begin to be scaled in once price is in the highlighted box.
Invalidated and exited if price extends to the stop level, otherwise left to mature.
Wish me luck!

Tesla -> EV Market On FireHello Traders and Investors ,
my name is Philip and today I will provide a free and educational multi-timeframe technical analysis of Tesla 💪
After Tesla stock retested the last strong support zone for bulls, the 0.786 fibonacci level at the $100 level, the recent pump over the past couple of weeks was no surprise at all.
On the weekly timeframe you can see that Tesla stock is currently retesting previous weekly structure and since Tesla is a little bit overextended we could see a short term drop from here.
However by looking at the daily timeframe you can also see that Tesla stock is not slowing down at all so not all three timeframes are pointing towards more growth yet so I am waiting for a daily and weekly break above the current resistance level and then I do expect more bullish upside.
Keep in mind: Don't get caught up in short term moves and always look at the long term picture; building wealth is a marathon and not a quick sprint 📈
Thank you for watching and I will see you tomorrow!
My previous analysis of this asset:

Tesla: The Only Foreign Automaker Committed to China's CompetitiI am excited to share that Tesla, the renowned electric vehicle manufacturer, has become the only foreign automaker to sign China's competitive pledge. This remarkable commitment showcases Tesla's dedication to the Chinese market and its determination to lead the sustainable transportation revolution in the region.
China, the world's largest automotive market, presents immense potential for growth and innovation. By signing this pledge, Tesla has positioned itself as a unique automaker in China, setting it apart from its competitors. This move solidifies Tesla's presence in the Chinese market and reinforces its commitment to fostering healthy competition and driving the industry forward.
As savvy investors, we must identify companies with a competitive edge, especially in emerging markets like China. Tesla's decision to sign this pledge highlights its strategic vision and ability to adapt to local market dynamics, which bodes well for its long-term success.
I encourage you to take a closer look at Tesla's operations in China as they continue to expand its manufacturing capabilities and strengthen its foothold in the region. By doing so, you will gain valuable insights into the company's growth potential and ability to capitalize on the immense opportunities presented by the Chinese market.
As with any investment, thorough research and analysis are essential. I recommend exploring Tesla's recent achievements, such as the impressive sales figures and the positive reception of their locally produced Model 3 in China. These milestones validate Tesla's commitment to the Chinese market and provide a glimpse into the company's future prospects.
In conclusion, Tesla's status as the only foreign automaker to sign China's competitive pledge is a significant milestone that sets them apart. Their unwavering dedication to the Chinese market positions them as a unique player in the industry, making them an intriguing investment opportunity.
I encourage you to delve deeper into Tesla's operations in China and assess its potential impact on its growth trajectory. We can make well-informed investment decisions that align with our goals and aspirations by staying informed and proactive.
Thank you for your time, and I wish you continued success in your investment journey.

TESLA CHART - WEEKLY TIME FRAME The Structure looks good to us, waiting for this instrument to correct and then give us these opportunities as shown on this instrument (Price Chart).
Note: Its my view only and its for educational purpose only. Only who has got knowledge about this strategy, will understand what to be done on this setup. its purely based on my technical analysis only (strategies). we don't focus on the short term moves, we look for only for Bullish or Bearish Impulsive moves on the setups after a good price action is formed as per the strategy. we never get into corrective moves. because it will test our patience and also it will be a bullish or a bearish trap. and try trade the big moves.
we do not get into bullish or bearish traps. We anticipate and get into only big bullish or bearish moves (Impulsive Moves). Just ride the Bullish or Bearish Impulsive Move. Learn & Know the Complete Market Cycle.
Buy Low and Sell High Concept. Buy at Cheaper Price and Sell at Expensive Price.
Keep it simple, keep it Unique.
please keep your comments useful & respectful.
Thanks for your support....
Tradelikemee Academy

Tesla Stock - Strong Bullish Pattern - $1000 Price TargetTesla stock is showing a strong bullish pattern with a price target of $1000 by 2025.

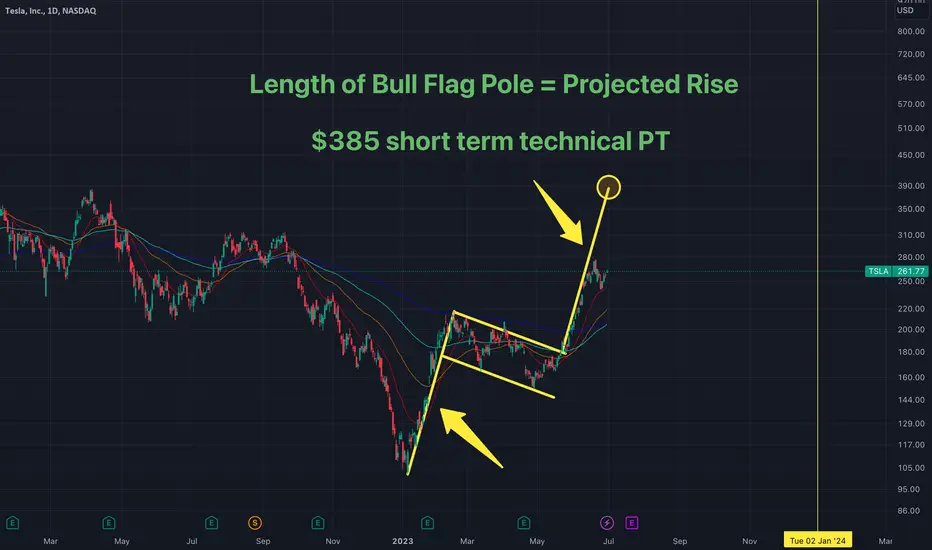
$TSLA - $385 Short Term Technical PT for Tesla StockAfter breaking out of a massive bull flag, the recent rise is projected to hit a short term technical PT of $385. Remember, length of the Bull Flag pole = Project rise.
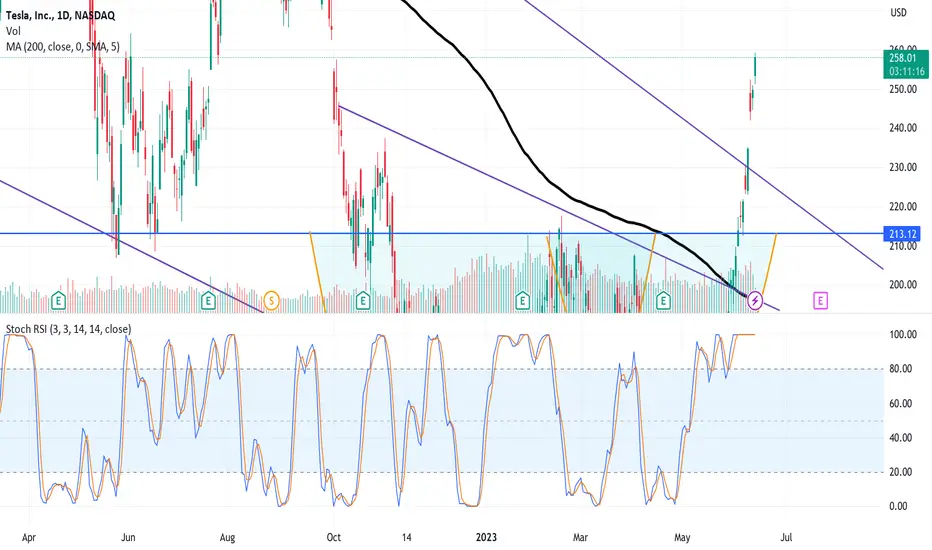
TSLA SMA Cross Signals Growth Opportunities - Time to Invest!Exciting News! TSLA SMA Cross Signals Growth Opportunities - Time to Invest!
As a fellow Tesla enthusiast, I couldn't wait to share the latest developments. Brace yourself for profound positivity because Tesla's future is brighter than ever!
You might have heard about Tesla's exceptional performance recently, but let me clarify the specifics. Tesla has been ramping up its production, delivering more cars than ever, and exceeding expectations. This remarkable growth has caught the attention of many investors, and rightly so!
Now, here's where it gets even more enjoyable. As Tesla continues to deliver more cars and increase its production capacity, we can expect a significant technical indicator to come into play - the TSLA Simple Moving Average (SMA) cross. For those unfamiliar with this term, it's a powerful tool to identify potential shifts in the stock's momentum.
With Tesla's expanding production, the TSLA SMA cross will likely signal an upward stock value trend. This means now is an opportune time to consider investing in TSLA stock. By taking advantage of this growth opportunity, you could be part of Tesla's remarkable journey toward a sustainable future while reaping the benefits of a potentially profitable investment.
So, my dear TSLA fan, I encourage you to seize this moment and seriously consider investing in TSLA stock. With Tesla's unwavering commitment to innovation, sustainability, and pushing the boundaries of what's possible, the potential for long-term gains is genuinely remarkable. Don't just be a fan; become an investor and be a part of Tesla's incredible success story!
If you need help getting started or need further information, please comment.
Wishing you an electrifying future with Tesla,

Short Tesla Short tesla here small size. Will add heavy either way on the Diamond pattern break if its not too violent and I can catch. Not advise

Tesla -> What About This?Hello Traders,
welcome to this free and educational multi-timeframe technical analysis.
On the weekly timeframe you can see that Tesla stock perfectly retested and already started to reject a major previous weekly structure area roughly at the $260 level.
You can also see that Tesla didn't retrace all the way back to the 0.382 fibonacci retracement level which is always the first strong support level after the recent massive pump so there could be a chance that we will see another short dip and then even more bullish continuation.
On the daily timeframe you can also see that Tesla just created bearish market structure by breaking the previous low towards the downside, however Tesla stock is still looking strong so I am also waiting for a short term daily drop before I do expect another bullish impulse leg.
Thank you for watching and I will see you tomorrow!
You can also check out my previous analysis of this asset:

Tesla -> The Sky Is The LimitHello Traders,
welcome to this free and educational multi-timeframe technical analysis.
On the weekly timeframe you can see that Tesla stock recently perfectly broke above a longer term bearish trendline in confluence with support at the $160 level and then created a rally of 40% towards the upside.
You can also see that from a weekly perspective Tesla stock is currently testing a major weekly structure zone which could now act as resistance exactly at the $270 level so I am now just waiting for a minor pullback before I will then look for the continuation towards the upside.
On the daily timeframe however you can see that Tesla is far from creating bearish market structure, there is no sign of weakness at the moment so I am just waiting for Tesla to slow down at the current leve and then I do expect a minor pullback towards the downside before the longer term bullish continuation.
Thank you for watching and I will see you tomorrow!
You can also check out my previous analysis of this asset:

Shorted Tesla $259Shorted Tesla here, online sentiment way to bullish....people calling for 400. 1 day Stochastic maxed 100/100.
Ninja Talks EP 9: Despair and HopeDespair and Hope, two sides of the same coin and the two emotions that rule your decision making.
In my 10+ years of trading experience, I'm not sure it's even possible to not feel or be aware of them in some way - what I'm saying is, I don't know if you can get rid of them entirely from your trading.
It may just be a constant (and natural) part of being a trader.
These days I use the intuition, awareness and knowledge about these two emotions to make the bulk of my money.
Techniques are autopilot at this point, same goes for money management, but psychology - hope - despair? They seem to be a daily "battle".
I put "battle" in quotes because, yes it's back and fourth but it doesn't need to be adversarial, do'ya know what I mean?
Too many Bambi traders run from despair and seek hope, but I use them differently - I use them as sensors of when to time an entry and exit perfectly - kinda like parking sensors on modern day cars, they're there to warn you - it's not good or bad, it's just warning you.
Hope this helps, follow for more Ninja Talks.
Nick

TSLA to Hit $300 from momentum and uptrend line.TSLA has a lot of momentum atm and can hit $300
The current valuation of TSLA is below what the value should be. There is potential for TSLA to be in the $450-$500 range by the Fall
Short Term Play:
Buy a $275 Call Exp: 6/16 - Close on 6/15 or 6/16
Buy a $290 Call Exp: 6/23 - Close at TP:$300+
Long Term Play:
Buy a $400 Call Exp: 11/17

Tesla -> Not Slowing DownHello Traders,
welcome to this free and educational multi-timeframe technical analysis.
On the weekly timeframe you can see that Tesla stock is currently breaking a bunch of resistance towards the upside, showing very strong bullish buying pressure overall.
You can also see that Tesla is approaching resistance at the $270 from which we could see a short term rejection towards the downside considering that over the past couple of weeks, Tesla stock rallied roughly 70% towards the upside.
On the daily timeframe you can see that market structure and momentum is still massively bullish so there is no reason to short Tesla now, I am personally waiting for a retest of the $230 level before I then do expect another bullish rally from there.
Thank you for watching and I will see you tomorrow!
You can also check out my previous analysis of this asset:

Tesla Short Selling short-midtermNew agreement will give customers access to 12,000 Tesla chargers
Ford (F) stock has advanced about 2.5% early Friday following CEO Chris Farley’s announcement that Ford owners will be able to charge their EVs at Tesla Superchargers beginning in early 2024. The announcement was made via a Twitter Spaces talk between Tesla (TSLA) CEO Elon Musk and Farley late Thursday.
NASDAQ 100 futures have gained 0.3% in Friday’s premarket as Dow and S&P 500 futures are ahead slightly less than 0.2%.
Tesla currently has more than 17,700 Superchargers but 12,000 of them will be made available to Ford owners. Ford customers will be able to pay using their existing Ford payment apps.

$TSLA Tesla - Too Much Speculation in The Price #StocksIn the short term, remnants of "the growth that was" has Tesla stock anchored to some higher prices. In the long term, the forecast looks a little more cloudy.
I wouldn't be surprised to see Tesla stock hit $200 or lower again before the next bull market REALLY begins. The stock is now trading outside of it's fundamental range of value. I would take the draw down from Friday as a sign of what's to come in the future.
Check out the Equity Channel Podcast on Apple, Spotify and Amazon to get more insights on trading and investing.

Short TeslaDCAing into a Tesla short here. Dont care what asset it is I will always start nibbling at a maxed out 1 day RSI. Short 20% of my max position for this trade, will add as it goes higher, dont care. This will mean revert. I will then long the cup and handle neck for bounce.
TESLA - THE NEXT TARGET IS?Positives so far:
- Clean break above PoC (explained in chart)
- Above 200 day SMA
- OBV is ascending
Its looking up for Tesla given recent GM partnership news however there is likely heavy resistance at approx. $300 #tesla NASDAQ:TSLA
Plan accordingly
PUKA

TESLA,inc Weekly --long term panorama
Tesla looks like its heading to the white resistance box in the range of 207-216 as a target 1.
It seems like its on a path to 412 in the future which is the ALL TIME HIGH for TESLA. Good future ahead for TESLA.
