TSLA Analysis and market prediction Hello everyone, as we all know the market action discounts everything :)
_________________________________Make sure to Like and Follow if you like the idea_________________________________
Wall Street's main indices ended sharply lower on Wednesday, with the tech-heavy Nasdaq confirming it was in a correction, after a diverse set of corporate earnings and as investors continued to worry about higher U.S. Treasury yields and the Federal Reserve tightening monetary policy.
When comparing the yearly performance of all stocks, we notice that TSLA is one of the better-performing stocks in the market, outperforming 82% of all stocks. We also observe that the gains produced by TSLA over the past year are nicely spread over this period. However, this overall performance is mostly based on the strong move around 4 months ago.
TSLA is currently trading in the middle of its 52 week range. The S&P500 Index however is trading in the upper part of its 52 week range, so TSLA is lagging the market slightly.
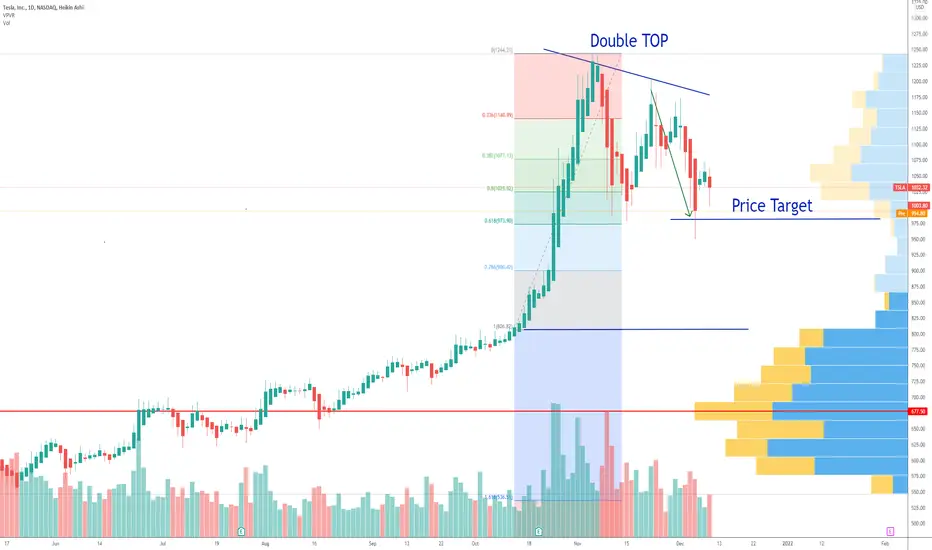
In the last month, TSLA has been trading in the 886.12 - 1208.00 range, which is quite wide. It is currently trading in the middle of this range, so some resistance may be found above.
Possible Scenario for the market:
The market is trading at 995.65 near the support level located at 989.12 where we might see a push back up to the first resistance near the 1120.00 range, but if the Bears were to keep control over the market then we will see a further drop that will reach the second support line located at 894.62.
The battle between the Bulls and Bears is instance right now, over control of the market direction. Notice how the Bears are pushing really hard in the last couple of days to drive the price down, and they were able to drop the price from 1109 to 995.
Technical indicators show :
1) The market is below the 5 10 20 50 MA and EMA (Bearish short-term) But still above the 100 and 200 MA and EMA (Bullish long-term)
2) The MACD is below the 0 line indicating a Bearish market, with a negative crossover between the MACD line and the Signal line.
3) The RSI is at 44.18 showing some weakness in the market, with no major divergence found between the indicator and the market.
Support & Resistance points :
support Resistance
1) 1007.45 1) 1062.18
2) 984.39 2) 1093.85
3) 952.72 3) 1116.91
Fundamental point of view :
TSLA's Return On Assets of 6.00% is amongst the best of the industry. TSLA does better than the industry average Return On Assets of -4.33% and TSLA shows a strong growth in Earnings Per Share. In the last year, the EPS has been growing by 174.51%, which is quite impressive.
Looking at the last year, TSLA shows a very strong growth in Revenue. The Revenue has grown by 66.27% and TSLA is expected to show a strong growth in Revenue. In the coming 5 years, the Revenue will grow by 35.52% yearly.
This is my personal opinion done with technical analysis of the market price and research online from Fundamental Analysts and News for The Fundamental point of view, not financial advice.
If you have any questions please ask and have a great day !!
Thank you for reading.
Teslashort

TESLA BEARISH CHANNEL 20% SELL OFFTesla is currently facing a high level of volatility, now we can see that is respecting a descending channel forming new lower highs and lower lows. The current price (1090) represents a good position to enter for a sell, whit a tight stop loss above the new lower high formed (1130) and a take profit at the support zone (880).

Tesla Swing Trade: ShortThere is nice setup for short term counter trend swing trade on NASDAQ:TSLA , after 4 day rally.
Price is technicaly exhausted, thats confirmed by today down open and retested resistance level at 1102 where price fail to close above.
On daily chart current price of NASDAQ:TSLA is too stretched from its 5 day EMA.
Tomorrow price action at close also indicate weakness on buying side at higher prices
==================================
Swing trade setup
==================================
Entry: 1090
Stop Loss: 1103
Profit Target: 1029
Trade duration: 1-3 days

TSLA Shorting Waiting for filling the gap, once it will be filled, i am putting an short position.
NOT FINANCIAL ADVICE, ONLY FOR EDUCATIONAL PURPOSES

Elon Musk dumps another $1 Billion TSLA StockIf you haven`t sold when he got the answer "yes" on twitter for selling his shares:
Then you should know that Elon Musk sold another 934,091 TSLA shares, according to filings with the SEC published on Thursday.
The shares are worth $963.2 million.
Ark Invest also sold TSLA shares.
What is your next move?
Will the madness keep up? Or are we beginning a down trend? TSLAShort on Tesla so long as we stay below the yellow trend line not sure if it is ready to continue upwards without another retest at 1000 and perhaps a break here could lead back down to 900.
Tesla is a mixed bag. Increasing EBIDTA looks good. Decreasing debt looks good. Debt to Equity ratio decreasing. Solid company.
But the P/B and P/E ratios are high indicating that Tesla is overvalued.
There is clearly a lot of faith for the future put in Tesla, will the time come for it to drop back down to a more representative valuation or will the madness will continue some more?
Might add to my short if the RSI hits overbought on this run upwards, perhaps this is the highest we see the price before a dip to 1060/1000.
Let me know your thoughts below. Constructive criticism and alternative viewpoints are always welcome. Please leave a like if you enjoy my analysis :)
And as always
Good day to you :)

Tesla Back to 950After breaking out of this channel, I believe that Tesla is heading back down to 950 to close the gap.

TESLA - SELL LIKE ELON !Hi all,
After last month drop on TESLA, we expect continuation down trend.
Elon get rid of TESLA. Market will be copy him .
Target on this year :
TP1 : 850 USD
TP2 : 750 USD
Share your opinion in the comments and support the idea with like.
Follow also appreciated.

Tesla Bullback down!!! (short)I think tesla goes down the next hours because its goes under the the line and is near at overbought and got a pullback down so yeah, im in tesla short!!

Tesla - sorry
After a big climb, I have already met rounded ground targets. deserves a minimum drop of 20%

Tesla ShortHi Traders,
This is one of our latest ideas on Tesla.
After seeing an extension from the 10/20 EMA as well as a spike in volume with divergence on 4H RSI taking into consideration "cause and effect", we should see a solid movement here and a retrace to the 50/618FIB and back to trendline - testing the 200MA and daily 200MA.
This is a 1:14 risk to reward.
Please see below for further details on us.
TH from RT_Trading

Dude, Where's My Tesla?We touched Claire boners hoo-hoo we're on the hook for one thousand dollars to a stripper, and the car's gone.

$TSLATesla shares closed at an all-time high of $909.68 on Friday, two days after the company reported record revenue and profits in the third quarter.
The move marks the first time since January the company made an intraday record. Shares surged above $900 a share shortly after market open.
Tesla’s strong earnings results stemmed from improved gross margins of 30.5% on its automotive business and 26.6% overall. The stock dropped under 2% in after hours trading on Wednesday.
Tesla’s market cap stood at roughly $860 billion at market close.
There’s no question about it.
Tesla have an incredible future and I’m ridiculously bullish on TSLA long term but in the short term, if we’re trading we should see a slight pullback.
I think we see one more push up before shorts come in control.
It’s getting quite over extended here with it getting into the overbought territory.
I think this stock is one to watch going into next week for a swing.
Long term bullish.
Watchlist this.
- Factor Four

TSLA to all time high today! Double TOP??TSLA is up another 4% in the pre-market which will send the stock to all time high this morning.
But Ark Invest is was constantly selling TSLA shares during the past week and i think they will continue today.
For example, Friday they sold more than 80 000 shares for around 73mil usd.
Which makes me think this could be a double top formation with a retracement to 730usd levels as shown in the Fibonacci retracement tool.
I`m looking forward to read your opinion about it.

Tesla - Ready for a dropRSI indicator showing that TSLA is overbought on the 4H chart. We see a retracement to $720 or $640.
For educational purposes only.

Teslas moment of truth - My interpretationI might be overestimating the importance of yesterdays trading session but I think this symmetrical triangle signals an important reversal.
The way I see it, yesterday the market made up it's mind for Tesla and now there was a reversal in the 4 month long uptrend.

Michael Burry is Right on this OneTesla held well during the dip but the bulls cant fend of the bears for too long.
I'm expecting a large drop in Tesla is you fail to clear $780

TESLA. HOLD OR SELL?WHEN TO BUY?Hey!
My idea is bearish
Decision price level is 700$ or zone of 685-705$.
When the company could not pay its debts, it issued additional issues and paid off its debts in this way. So it was profitable to keep stock prices at high levels plus squeezing out short sellers. Now operating activities cover all costs, so the capitalization is not very important for the company's management. Now Tesla have a nice cash flow, low debt. The perspectives of growth here are high, but due to high P/E and P/S we should be ready for price correction.
I see 8 reasons for deep correction right now:
1. Historically, September is a bad month for the markets.
2. Right now, the correction phase begins, the depth of which will be at least 3800-4000 according to the S&P500 index.
3. A good and understandable potential for a price drop.
4. The serial production of the truck and pickup truck was postponed.
5. There will be poor sales reports due to a shortage of chips.
6. The systemic crisis in China (evergrande and Alibaba) may affect the purchasing potential in the future
7. Cash flow financing due to an additional issue no needs to make anymore.
8. Joe is sleeping.
And what if?
If S&P500 correction will be stopped this or next week than it will be possible to see the new high.

TSLA heavily shorted by Michael Burry!SCION ASSET MANAGEMENT, the hedge fund owned by Michael Burry - the man who bet against the housing market in 2008, if you are too young, you know him from "The Big Short", is now heavily betting against TSLA!
He owns puts on Tesla for 35% of his portfolio, with a market value of $731,017,000!
Besides the strong competition that TSLA has now in the EV sector, the U.S. National Transportation Safety Board would open an investigation into a fatal crash earlier this month involving a Tesla vehicle in Florida that led to the deaths of two people.
My first price target is 690, but it can drop even further, to 601usd.

TESLA - INTO NEW BREAKDOWN TRENDHello trading friends,
US market is open, and tesla looks to break down before the weekend. we will see coming time the signals or this will get acctived. the TA shows a breakdown trend.
Have a great day.

Tesla's Make-it Or Break-it!Tesla is approaching a very critical spot. There are several key technicals that all speak in favour of it having topped out in January. If that's the case it automatically means that whatever we're seeing right now is the height of its distribution phase prior to rolling over for some serious price damage.
Let's go through those technical clues, one by one.
1) We have a textbook primary 5-wave impulse.
A normal 2nd-wave correction is a steep price correction. In Tesla's case, we saw a retracement to the 786 fib - one that found support on it with uncanny precision. Equally so, a normal 4th-wave correction is a complex time-based correction - one that typically materialises in the shape of a triangle. According to these standard rules, Tesla abides to both.
2) Whenever you draw a fibonacci retracement from the bottom of a 5-wave impulse and to the end of the 5th-wave, the bottom of the 4th-wave correction statistically aligns with the 618. And so, too, it does here. Naturally, this further speaks in favour of Tesla having topped out for this primary and secular market cycle, as in for a long time to follow.
3) The RSI is our by far best tool in determining whenever a mark-up shifts into a distribution. What happens is that the RSI goes from consistently high levels - often overbought such - to swiftly retrace down towards the green neutral 50-line, upon which it then fails to break above the upper bearish blue line (see the red cirle on the chart). This is a pivot at which the RSI and price suffer syncronised "max pain" and is equally so THE ideal spot to open short positions.
4) The price is currently nearing in on the golden 618 ratio. This is where I will begin to ladder in shorts. Yet, if the price were to slip too far into the zone, I'll release it and re-enter again at the 786.
But here's the thing. IF Tesla were to break above this critical zone I will consider laddering in leveraged longs. And there are two prime reasons for that.
1) The long RSI divergence (the dotted red line) is typical 3rd-wave behaviour. This is more standard than not. By that token, it would mean that the current triangular-looking price development in fact is the real primary 4th wave, upon which we can expect a final price pump to the north.
2) A price pump above the red danger zone would mean that the weekly RSI would break the upper bearish blue line, and hence disqualify it entirely.
In this sense, as long as Tesla stays within or below the red danger zone a short play is the predominantly correct move from a statistical point of view. This is likely to result in a high risk-to-reward short spot - one in which we can utilise high leverage due to the low risk.
If, on the other hand, Tesla were to break above this zone, the probabilities swiftly shift from very bearish to very bullish.

Bearish TSLA Forecast 'Twitter'
I'd say I'm not a fan of microchips or RFID anywhere near the human body, for that matter my sentiment of TSLA becoming bearish will take hold.
NASDAQ:TSLA
BCBA:TSLA
MIL:TSLA
MOEX:TSLA-RM
FTX:TSLAUSD
BITTREX:TSLAUSD
BINANCE:BTCUSDT
TVC:DXY
BITTREX:DOGEUSD
BITSTAMP:XRPUSD
NYSE:GME
NYSE:AMC
TVC:SPX
CURRENCYCOM:UK100

$TSLA - @Stacking said run it to $800Old school technicals
Trendline break
SR flip
Little Range consolidation here
Expecting upside expansion
Only weakness with this setup is the H1 gap that has been left underneath this consolidation
Too have a higher R can keep stops above it expecting expansion soon
However, if the consolidation low gets deivated, fills that H1 gap, that should be a giga long!
See you at $800 Elon
