Tether Rakes in $4.9B Q2 Profit, Cementing Its Reign as Crypto’sTether Q2 Net Profit Hits $4.9 Billion, Pushing Total Earnings to $5.7 Billion: What It Means for the Crypto Industry
Tether Holdings Ltd., the issuer of the world’s largest stablecoin USDT, has once again made headlines with its Q2 2025 earnings report, revealing a staggering net profit of $4.96 billion. This brings the company’s total profits for the first half of the year to $5.7 billion—a record-breaking milestone for both the company and the broader stablecoin ecosystem.
This article explores the implications of Tether’s Q2 performance, the sources of its revenue, its impact on the crypto markets, and the growing significance of stablecoins in the evolving financial landscape.
________________________________________
A Record-Setting Quarter for Tether
Tether’s Q2 2025 results have astonished even seasoned analysts. The company’s reported $4.96 billion in net profit in a single quarter represents one of the most profitable periods in the history of any fintech or crypto-native company. What’s even more remarkable is that this profit was not driven by speculative trading or token sales, but by conservative, yield-generating strategies rooted in traditional finance.
The company’s Q1 earnings were already impressive at $0.76 billion, but Q2’s results eclipse those numbers entirely. Tether’s cumulative profit year-to-date now stands at $5.72 billion, putting it on track to potentially exceed $10 billion in earnings for the full year if current trends continue.
________________________________________
What’s Driving Tether’s Massive Profit?
Tether’s incredible profitability is primarily fueled by one key factor: the interest earned on its reserves. As the issuer of USDT, Tether is responsible for maintaining a 1:1 backing of every token in circulation. These reserves are primarily held in short-term U.S. Treasury Bills (T-Bills), reverse repos, and cash equivalents.
Here’s a breakdown of the main profit drivers:
1. High Interest Rates on U.S. Treasuries
With the U.S. Federal Reserve maintaining elevated interest rates to combat inflation, short-term T-Bills have become highly lucrative. Tether holds tens of billions of dollars in these instruments, generating billions in annual interest income.
For example, the yield on a 3-month Treasury bill in Q2 2025 averaged around 5.2%, and Tether’s reserve base has hovered near $90 billion to $100 billion. Even a conservative allocation can earn several billion dollars in annual yield.
2. Reverse Repurchase Agreements (Reverse Repos)
Tether has also expanded its use of reverse repos, which allow it to lend cash to counterparties in exchange for securities, earning a premium on the transaction. This has contributed significantly to its earnings, especially in a high-yield environment.
3. Gold Holdings and Bitcoin Exposure
Tether has acknowledged that a small portion of its reserves includes gold and Bitcoin holdings. These assets appreciated in Q2, contributing to the overall profit. While not the primary revenue source, their performance added notable value during the quarter.
4. Equity Investments
The company has begun investing in infrastructure and technology firms related to blockchain and AI. While these investments are not liquid, mark-to-market gains may have also contributed to the net profit figure.
________________________________________
A Closer Look at Tether’s Reserve Report
Tether’s Q2 attestation report, published alongside its earnings update, provides transparency into how its assets are allocated. Here are some highlights:
• Over 85% of reserves are held in U.S. Treasury instruments
• $5.4 billion in excess reserves—a buffer above the value of circulating USDT
• $3.3 billion in gold and Bitcoin holdings
• Minimal exposure to unsecured commercial paper or riskier debt instruments
Tether has continuously emphasized its commitment to transparency and risk management. Unlike in its early years, when it faced criticism over opaque reserve practices, the company now releases quarterly attestations audited by third-party firms such as BDO Italia.
________________________________________
USDT’s Growing Dominance
Tether’s profits are closely tied to the growth of its flagship product: USDT, the world’s largest stablecoin by market cap. As of August 2025, USDT has a circulating supply exceeding $110 billion, giving it a dominant share of the stablecoin market.
This growth can be attributed to several factors:
1. Increased Adoption in Emerging Markets
USDT is widely used in countries with unstable fiat currencies, such as Argentina, Nigeria, and Turkey. For many users, USDT represents a dollar-denominated safe haven in environments plagued by inflation and capital controls.
2. DeFi and Cross-border Payments
USDT continues to be a core asset in decentralized finance (DeFi) protocols, serving as a stable medium of exchange and collateral. It's also a preferred tool for cross-border remittances, given its speed and low transaction costs compared to traditional banking systems.
3. Institutional Integration
Major crypto exchanges, custodians, and payment processors have incorporated USDT into their platforms, driving further liquidity and utility. In many cases, USDT is preferred over fiat due to its 24/7 availability and blockchain-native nature.
________________________________________
What Does This Mean for the Crypto Industry?
Tether’s Q2 performance is more than just a corporate milestone—it’s a bellwether moment for the crypto industry. It signifies the maturation and institutionalization of digital assets and stablecoins. Here’s what it means for the broader ecosystem:
1. Stablecoins as Profitable Financial Products
Tether’s profitability proves that stablecoins are no longer just “crypto plumbing.” They are now financial products generating billions in yield, much like money market funds. This is reshaping how investors and regulators think about stablecoins—not as speculative tools, but as interest-bearing assets backed by real-world securities.
2. Regulatory Scrutiny Will Intensify
With Tether generating profits that rival traditional banks, expect regulators to increase oversight. Stablecoins have long been in the crosshairs of the U.S. Treasury, SEC, and global central banks, and Tether’s dominant market share will likely place it under further examination.
However, Tether’s transparency efforts, including quarterly attestations and reserve disclosures, may help it navigate these regulatory waters more effectively than in the past.
3. Competition Will Escalate
Tether’s extraordinary profits will likely attract new entrants and existing competitors to the stablecoin arena. Circle’s USDC, PayPal’s PYUSD, and even central bank digital currencies (CBDCs) are all vying for market share.
Tether’s early-mover advantage, global reach, and deep liquidity make it hard to displace, but increased competition could pressure margins in the long term.
4. Decentralized Alternatives Will Seek Market Share
Decentralized stablecoins like DAI, FRAX, and USDD aim to offer alternatives to centralized issuers like Tether. While they remain relatively small, the ethos of decentralization might gain appeal, especially in regulatory-heavy environments.
Still, decentralized stablecoins have struggled to maintain pegs during market stress, giving Tether an edge in terms of trust and resilience.
________________________________________
The Road Ahead for Tether
As Tether moves into the second half of 2025, several strategic themes will define its trajectory:
Continued Profitability
If interest rates remain elevated and USDT circulation continues to grow, Tether’s annual profit could reach or exceed $10 billion—putting it in league with the most profitable fintech firms globally. This surplus could be reinvested in:
• Infrastructure expansion
• Strategic acquisitions
• Reserve diversification
• R&D for stablecoin innovation
Expansion into Emerging Markets
Tether has hinted at expanding its presence in Latin America, Africa, and Southeast Asia, where demand for dollar-denominated assets is high and banking infrastructure is limited. Expect to see more localized partnerships and on-ramp/off-ramp solutions.
Embracing Blockchain Innovation
Tether is already deployed on multiple blockchains—Ethereum, Tron, Solana, and more. The company is likely to support new Layer 1s and Layer 2s to enhance speed, reduce costs, and maintain competitiveness in the DeFi space.
There are also rumors that Tether may be exploring tokenized asset offerings and programmable money features, allowing USDT to integrate more deeply with smart contracts and enterprise use cases.
________________________________________
Criticisms and Controversies: Still Lingering?
Despite its success, Tether continues to face criticism from parts of the crypto community and regulatory world. Concerns include:
• Lack of full audits (attestations are not the same as full financial audits)
• Opaque ownership structure
• Past legal issues, including settlements with the New York Attorney General and the U.S. CFTC
However, it’s worth noting that Tether has addressed many of these concerns over the past two years. Its transparency has improved, and its operations have become more conservative and professional.
Still, its scale and impact on the crypto market mean that any misstep could have systemic consequences. Investors and regulators alike will continue to scrutinize its activities.
________________________________________
Final Thoughts: Tether’s Moment of Ascendance
Tether’s Q2 2025 net profit of $4.96 billion doesn’t just reflect a successful quarter—it marks a paradigm shift in crypto finance. What began as a controversial stablecoin project has evolved into a global financial powerhouse, rivaling traditional banks and asset managers in profitability.
More than just a win for Tether, this moment signals the growing legitimacy of stablecoins in the global financial system. It shows that crypto-native firms can not only survive but thrive in traditional financial environments, leveraging yield, transparency, and blockchain infrastructure to create sustainable business models.
As the world watches, Tether’s next chapters will likely be shaped by innovation, regulation, and global expansion. But for now, with $5.7 billion in profits in just six months, one thing is clear:
Tether is no longer just a stablecoin issuer—it’s one of the most powerful financial entities
in the digital age.
________________________________________
Disclaimer: This article is for informational purposes only. It does not constitute financial advice. Always conduct your own research before making investment decisions.
Tether
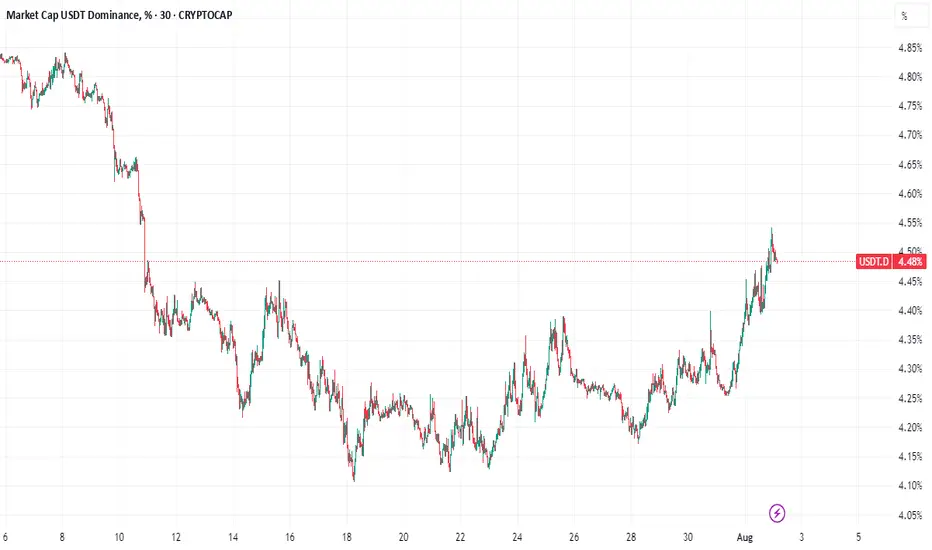
100% Win Rate on BTC & Alts! Where’s the Next Breakout?USDT Dominance Update:
While the herd chases the latest hype, we called this before it even unfolded. BTC’s recent surge was lightning-fast.
These were the trades shared in the last 30 days. I'm just saying we could've had more wins!
Our setups didn’t just hit targets…
They exploded through them 🚀
These are spot gains, imagine trading wth leverage with these.
There's more to come in the next week.
✅ MIL:ENA +53%
✅ HOSE:VIC +50%
✅ $CHILLGUY +40%
✅ NASDAQ:HUMA +35%
✅ CRYPTOCAP:XRP +34%
✅ $VOXEL +32%
✅ OMXTSE:MAGIC +30%
✅ CRYPTOCAP:RENDER +25%
✅ CRYPTOCAP:AVAX +24%
✅ SEED_DONKEYDAN_MARKET_CAP:FLOKI +25%
✅ CRYPTOCAP:LINK +17.65%
✅ CRYPTOCAP:SUSHI +17.3%
✅ AMEX:MBOX +15%
✅ $MAVIA +14.7%
✅ TVC:MOVE +11.66%
✅ $EPT +11%
✅ BME:ETC +10.3%
✅ PSX:POL +20%
✅ CRYPTOCAP:SUI +20%
✅ LSE:ONDO +7.5%
✅ SET:PORT +6.17%
✅ CRYPTOCAP:TON +3%
📈 These aren’t just simple trades; they’re alpha-backed calls.
If you’re still watching from the sidelines…
You’re watching others print.
Be patient and precise with your entries and exits. Never FOMO.
The market will bait you into bad timing if you let it.
A 4.4% drop in USDT dominance marks the start of a new altcoin season, but remember, BTC will steer this cycle.
More setups on the way.
Stay tuned.
Do hit the like button and share your views in the comments.
Thank you
#PEACE

USDT Dominance Locked in Range – Altseason Not Ready Yet?USDT Dominance has been trading inside a wide sideways range for the last 567 days — bouncing between the 3.6% demand zone and the 6% supply zone.
The recent price action shows a rejection from the top of the range and now heading toward the mid or lower part of the channel. A minor trendline (in red) had shown some short-term support, but it looks weak now.
As long as this range holds, true altseason may remain on pause. The big move will come only when USDT.D breaks out or breaks down from this range.

USDT.D Showing Signs of Bounce – Altseason at Risk?USDT Dominance is still moving within a rising parallel channel, holding just above the nearest support zone. After a brief dip, price is now showing signs of recovery from the lower boundary of the channel.
However, the key resistance zone near the top of the channel has proven tough to break — it rejected price on the last attempt.
Until we get a clear breakout or breakdown from this channel structure, the market may remain choppy. A breakout above 5.00% could signal risk-off sentiment (bad for alts), while a drop below the support zone may trigger altcoin momentum.
Stay cautious — the market is still undecided.

Stablecoins will Supercharge Cryptos AdoptionCME: Micro Bitcoin Futures ( CME:MBT1! ), #microfutures
On June 5th, Circle Internet Group ( NYSE:CRCL ), issuer of the #USDC #stablecoin, debuted its initial public offering at $31 per share. By June 23rd, NYSE:CRCL prices peaked at $298.99, up nearly ten folds in just 13 trading days.
At Friday's closing of $180.43, Circle has a market cap at $40.2 billion. Wall Street gave a mindboggling price earnings ratio of 234, based on Circle’s $0.77 earnings per share.
How to Invest in Stablecoins
Stablecoins are cryptocurrencies that aim to maintain price stability. Both USDC and #USDT (issued by #Tether) peg their value to the US dollar. Paying $1 for 1 stablecoin, you will get exactly $1 back in one month, one year, or ten years. Unlike buying Bitcoin, there is no investment return for holding stablecoins. So why would anyone want them?
Because stablecoins are not investment instruments, instead, they are payment methods. Like PayPal and Apple Pay, USDT and USDC enable users to move money fast and cheaply globally, but now in the crypto world.
How do stablecoin issuers make money? They generate revenue through interest on reserves, transaction fees, lending, and partnerships with financial institutions.
• The biggest source of revenue is interest income. When it comes to stablecoin issuers, size matters, and the Fed matters.
• Based on a study by Artemis, Castle Island Ventures, and Dragonfly on May 29th, USDT and USDC have a combined market capitalization of over $214 billion.
• With the Fed Funds rate averaging above 5% last year, the $214 billion reserve investing in Treasury and other high-quality bonds could yield at least $12 billion between Tether and Circle.
• Tether reported 2024 profit of $13 billion, while Circle generated $1.68 billion last year.
Investing in stablecoins means buying Circle stock, not converting cash into USDC. The difference is like buying Apple stock vs. adding money in your Apple Pay account.
Headwinds and Tailwinds
On June 17th, the US Senate passed the GENIUS Act of 2025. It establishes a regulatory framework for the $250 billion market for stablecoins. “Stablecoins are a paradigm-shifting development that can bring our payment system into the 21st century", declared Sen. Bill Hagerty of Tennessee, who introduced the bill.
With regulatory certainty, real-world utility and adoption will quickly follow. The future for stablecoins is very bright, and I expect the market size to double soon. However, market leaders Tether and Circle both face strong headwinds going forward.
• Real world utility brings in fierce competition. Big banks and credit card issuers will create their own stablecoins to keep customers on the book. This will slow down Tether’s and Circle’s efforts to attract mainstream financial investors.
• I expect the Fed to cut interest rates by a lot during the remaining 3-1/2 years of the Trump Administration. Some cuts will happen under the current Fed Chair. A lot more will come by his successor beginning June 2026. Lowering interest rates by 100-200 basis points will cripple stablecoin issuers’ main income.
In my opinion, the high dependency in growth and interest rate policies make NYSE:CRCL a very risky investment at the current lofty valuation.
Bullish Signal for Bitcoin
In the past, stablecoins were mainly used by crypto investors. Going forward, mainstream investors will find compelling offerings from their banks, stockbrokers and credit card companies. When mainstream financial intermediaries begin making serious inroad into cryptos, there will be a paradigm shift.
In my opinion, the new development in stablecoins will supercharge the growth of crypto market size. Bitcoin, being well established as a Digital Gold, will benefit the most from the global asset reallocation to cryptocurrencies.
An investor sharing a bullish view on bitcoin could explore the CME Micro Bitcoin Futures ( LSE:MBT ).
Last Friday, the August MBT contract (BTCQ5) was settled at 108,640. Each contract has a notional value of 0.1 bitcoin, or a market value of $10,864. To buy or sell 1 contract, trader is required to post an initial margin of $2,598. The margining requirement reflects a built-in leverage of 4-to-1, which is more cost-effective that buying bitcoins from any ETF fund.
A long MTC strategy with a stop-loss would enhance the returns while limiting the potential losses. Below is a hypothetical trade for illustration purposes only:
On Day T+0, buy 1 BTCQ5 at 108,640 and set a stop loss at 105,000
• The portfolio value is 10,864
• Upfront margin is $2,598
Rising Bitcoin Scenario: On Day T+N, Bitcoin goes up 20% to $130,368
• Futures gain will be $2,172.8 (= (130368-108640) x 0.1)
• Investment return will be +86.6% (= 2172.8 / 2598), excluding transaction fees
• This compares to a 20% gain with bitcoin ETF, with no leverage
Falling Bitcoin Scenario: On Day T+N, Bitcoin drops 20% to $86,912
• With a stop-loss at 105,000, losses will be capped at $364 (= (108640-105000) x 0.1)
• Investment return will be -14% (= -364 / 2598)
• This compares to a 20% loss with bitcoin ETF, with no stoploss provision
Happy Trading.
Disclaimers
*Trade ideas cited above are for illustration only, as an integral part of a case study to demonstrate the fundamental concepts in risk management under the market scenarios being discussed. They shall not be construed as investment recommendations or advice. Nor are they used to promote any specific products, or services.

USDT.D Consolidation Near Breakout Zone – Eyes on the Next MoveHello traders, here is the USDT.D update:
The chart is currently hovering near a major resistance zone, one that historically plays a key role in triggering altseason.
After a period of consolidation inside the mid-range S/R zone, price is now testing the downtrend line from above. A clear rejection here could spark renewed confidence in altcoins, giving them space to rally.
On the flip side, a breakout above this level may delay altseason momentum, as capital remains parked in stablecoins.
For now, this zone is the make-or-break area for altcoin sentiment. Keep it on your radar, the next move could set the tone for the coming weeks.

Tether Dominance matters!USDT #tether dominance is forming a bullish flag in lower time chart. If #usdtd manages to breakout, the next wave of correction will hit #bitcoin and #altcoins. If USDT.d loses %4.75 , that will be the invalidation.

Bitcoin’s Decentralization Is a Fairy TaleBitcoin was born as a revolutionary, decentralized currency, promising financial freedom and independence from traditional banking systems. Yet, as we analyze its real-world distribution, it becomes clear that Bitcoin’s decentralization is more myth than reality.
🔍 The Illusion of Decentralization
Bitcoin operates on a decentralized blockchain, meaning no single entity controls the network. However, when we examine who actually owns Bitcoin, we see a highly concentrated wealth structure that mirrors traditional financial inequality.
📊 Bitcoin’s Wealth Concentration
The top 0.01% of Bitcoin wallets control over 37% of total supply.
The top 1% of Bitcoin holders control over 40% of Bitcoin.
The top 2% of Bitcoin wallets control over 95% of total supply.
The bottom 98% of wallets hold less than 5% of Bitcoin.
The bottom 50% of wallets hold less than 0.03% of Bitcoin.
10,000 Bitcoin investors own 5 million BTC, worth $230 billion.
Institutional investors and early adopters dominate Bitcoin ownership.
This means that a tiny fraction of wallets dominate the entire market, while millions of small holders own completely insignificant amounts.
💰 Bitcoin vs Traditional Wealth Inequality
Bitcoin was supposed to be more equitable than traditional finance, but its wealth distribution is even more extreme than global financial inequality.
Bitcoin’s wealth gap is far worse than traditional financial inequality, proving that decentralization does not mean fair distribution.
📉 How Did Bitcoin Become So Centralized?
1. Early Adopters Accumulated Massive Holdings
Bitcoin’s first miners and tech-savvy investors acquired BTC when it was nearly worthless.
Many of these wallets still hold huge amounts, making redistribution difficult.
2. Institutional Investors Took Over
Hedge funds, exchanges, and corporations now control a massive portion of BTC.
Bitcoin ETFs and custodial wallets concentrate ownership even further.
3. Lost & Dormant Bitcoin Shrinks Circulating Supply
An estimated 29% of Bitcoin is lost or inactive, meaning fewer coins are available.
This makes the remaining BTC even more concentrated among active holders.
🚨 The Harsh Reality: Bitcoin Is Not Financial Freedom
Bitcoin was supposed to empower individuals, but in practice, it has become a playground for the wealthy.
Decentralization in theory ≠ decentralization in reality.
Institutional investors and exchanges hold a massive portion of BTC.
Bitcoin’s fixed supply (21 million BTC) makes redistribution nearly impossible.
Bitcoin is not the democratized financial system it was promised to be—it’s just another asset class where the rich get richer.
NASDAQ:MSTR NYSE:CRCL NASDAQ:COIN TVC:GOLD TVC:SILVER INDEX:BTCUSD NASDAQ:TSLA TVC:DXY NASDAQ:HOOD NASDAQ:MARA

USDT.D Breakout Fading — Relief Rally Ahead for Crypto?Yesterday’s spike in USDT.D during the volatility shook the market hard — but look closer 👀
This breakout above the range could be a seller’s trap. We saw a breakout attempt with strong wicks and rejection right after, hinting that buyers might regain control soon.
The false breakdown earlier and quick reclaim of the range further supports this bias.
If USDT.D starts falling again, it could fuel a recovery in risk assets (BTC + alts). For now — watching for confirmation, but cautioning against chasing fear here.
Stay sharp

#MARKET DUMPED! What's Next?Honestly, I didn’t expect this move to play out the way it did.
I’ve been warning about a potential breakout on the lower timeframes, and in hindsight, the signs were all there, but I still missed it. It happens, even to the best of us.
Took a few hits with stop-losses today. But no complaints, it’s a small dent compared to what we’ve gained over the past few weeks.
Now, shifting focus. I’m watching this chart closely — this is the 130 EMA on the 4H, which has historically done a great job identifying short-term rejections and bounces. It’s already plotted, and I’ll continue tracking it.
If we break above this level, there’s a strong chance
CRYPTOCAP:BTC can revisit the 98k zone. Until then, stay cautious and avoid High leverage.
Holding LSE:TAO $EIGEN and a few more.
No need to force trades, let the setup come to you.
One more thing, I am still not Bearish, it's a shakeout right before the real move! So be alert when opportunities come to you.
I was planning to take a break today, but not like this tbh.
Stay tuned
We adapt and move forward. Always!
Cheers
Do show your support and hit that like button.
Thank you
#PEACE

$USDT: A Critical Close Is Approaching. BULL TRAP or ALTSEASON?This one’s more important than most people realise.
Alts will either explode from here, or this recent ATH turns out to be a bull trap, the last rally we've been waiting for may take a little more likely.
I personally think this is an unlikely scenario but if you really intend to make big bucks in this market, you gotta be ready for every outcome.
No bs. No noise. Just the facts.
I'll recommend that you bookmark this post to stay updated.
Do hit the like button if you like this post.
Thank you
Stay safe folks
#PEACE

USDT Dominance Tells Us That Shakeout AheadHello, Skyrexians!
Despite most of traders now already do not believe in correction for Bitcoin, CRYPTOCAP:USDT.D is showing the potential warning sign. For sure my global forecast for this chart that Tether dominance will go below 2% is still actual. You can find it here . By the way it's playing out great. But in the short term shakeout is likely.
12 hours time frame Awesome Oscillator shows that wave 1 of global C has been finished. Now it's time for reactive wave 2. The most likely target is 5.3% at 0.5 Fibonacci. Only from there I expect crypto bull run continuation (for BTC) and start (for altcoins).
Best regards,
Ivan Skyrexio
___________________________________________________________
Please, boost this article and subscribe our page if you like analysis!

Monitoring USDT- Absolutely not a prediction.
- Just doing this chart to observe 1D (smaller timeframe) on USDT Dominance & Sharing.
- I usually like to use larger TF to reduce the noise on charts ( 1W, 2W, 1M, 3M ).
- USDT.D have to break out 8.4% before 13th December.
- if it does, could mean BTC more downward pressure.
- if it fails, BTC could rally up.
- Patience is the key.
Happy Tr4Ding !

USDT Megaphones- Over the past few years, I've posted numerous charts on USDT and most of them have been spot on. In trading, what goes up must eventually come down. That's just how the market works. i will link my older analysis following this post.
- To predict a BTC pump using USDT dominance (USDT.D) is actually quite simple. When USDT printing slows down or stops, USDT dominance tends to rise, indicating less liquidity flowing into the market and BTC usually drops. But when more USDT is printed, it signals growing demand and inflow of capital. As a result, USDT dominance drops and BTC typically moves up.
- back to the trend :
You can clearly identify two megaphone patterns:
– The first began in 2018 and ended in 2022, following Bitcoin’s bull run to $70K. ( Green ).
– The second started in 2022 and is still unfolding today." ( Yellow ).
- the key point to look closely is 6.40% Dominance.
- From 2022 to 2024 this point acted multiple times as support.
- but from January 2024 ( Orange Vertical dotted Line) it started to act as resistance.
- As I always say, support has a nasty habit of turning into resistance, and once again, that’s exactly what happened here."
- USDT has now entered a bearish megaphone pattern, and I expect it to continue moving lower, if USDT.D broke down 3.80%, 2.70% is coming next.
Based on this, BTC is likely to move higher, the bull run isn’t over, time to stack more sats !
Happy Tr4Ding !

Bitcoin Hype vs. Reality: A Breakdown of Bitcoin DelusionBitcoin enthusiasts often dream of mass adoption, corporate treasuries, and state-backed investments driving its price to astronomical levels. But let’s examine the actual numbers behind these claims.
🔹 The $1M Bitcoin Fantasy
Many believe Bitcoin will reach $300K, $500K, or even $1M. But what does that actually require?
💰 Bitcoin’s current circulating supply is approximately 19.5 million coins.
💰 At $830K per coin, the total market cap would be $16 trillion—which is:
✅ More than China’s entire GDP ($6T)
✅ 5x the market cap of Apple, Microsoft, Amazon, Google & Tesla combined
To put this into perspective, the entire global crypto market cap is currently around $2.99 trillion. Expecting Bitcoin alone to hit $16 trillion is beyond unrealistic.
🔹 Why Government & Corporate Adoption Won’t Skyrocket Price
Bitcoin believers often cite governments and corporations buying Bitcoin as proof it will moon. But here’s the reality:
⚠️ State & corporate purchases are OTC (Over-The-Counter) deals—they do not impact market prices like retail speculation.
⚠️ Governments negotiate strategically, they don’t impulsively buy at public prices to pump the asset.
⚠️ Treasury holdings do not guarantee higher prices—they only serve as reserves, not market drivers.
State adoption might increase legitimacy, but it won’t magically push Bitcoin past gold or global GDP levels.
🔹 Bitcoin’s Volatility vs. Gold’s Stability
Bitcoin is often compared to gold as a store of value, but its history tells a different story:
📉 Bitcoin has crashed over 80% multiple times—far from a stable asset.
📉 Extreme volatility makes it unreliable for wealth preservation.
📉 Liquidity issues create uncertainty, making it impractical for widespread adoption as money.
Gold, by contrast, has proven stability for centuries, with intrinsic value, industrial use, and universal acceptance.
🔹 Bitcoin Will NOT Absorb the Global Economy
Some claim Bitcoin will replace fiat, surpass gold, and absorb trillions in wealth. But the economic reality is:
❌ Bitcoin remains speculative, driven by market sentiment, not intrinsic value.
❌ No nation will abandon fiat for Bitcoin—they will regulate, integrate, but never replace sovereign currency.
❌ Bitcoin lacks industrial utility—gold has actual use in electronics, medicine, and aerospace.
🔹 The Crypto Dream vs. Financial Reality
Crypto thrives on believers, feeding them narratives that sound appealing but don’t match real-world economic fundamentals.
Bitcoin is not overtaking gold.
Bitcoin is not absorbing global wealth.
Bitcoin is not making every holder a millionaire.
Numbers don’t lie, but ignoring them won’t change reality. When the hype fades, speculative investors will face the harsh truth: Bitcoin is not a guaranteed path to riches—it’s a high-risk, volatile asset that operates in an unpredictable market.

Tether Dominance, TA» There is a lower high on the chart. This is a long-term timeframe. The signals are very strong here.
» There is a strong rejection at SMA200, this level being confirmed as resistance.
» There is a very strong decline in volume.
» There are three consecutive weeks closing red.
These are all very powerful bearish signals.
» This week wicked lower compared to 24-March.
Tether Dominance just produced the lowest reading on a drop since November 2024. When USDT.D was moving down in November 2024, everything Crypto was moving up. The conditions are similar today.
Tether Dominance can be seen moving down as a continuation of a bearish trend. This is happening after a lower high is fully in and confirmed.
Short-term, there can be a small pullback followed by lower prices.
For example, several days can close green but by the time next week ends, the action turns full red. Just as it happened on the 7-April week. The action started strongly bullish but USDT.D ended with a bearish week and the start of a decline that will lead to a lower low.
We are likely going to see the lowest reading on this index since March 2022 or December 2021. It is a long process but the chart is pointing down. That is what the chart says.
Thank you for reading.
Namaste.

BREAKING: Tether at Decisive point! Rejection means Reversal!$Tether is approaching a key resistance level.
A rejection here could trigger a temporary recovery in the broader market.
This rejection may signal a potential trend reversal if confirmed on higher timeframes.
However, a break above this resistance would likely mean no altseason for the next few months possibly until the end of the year.
If you found this helpful, please hit that like button.
I’ll update this chart and share insights you can use in your trading decisions.
Also, drop your thoughts in the comments I’d love to hear what you think.
Thank you.
#Peace ✌️

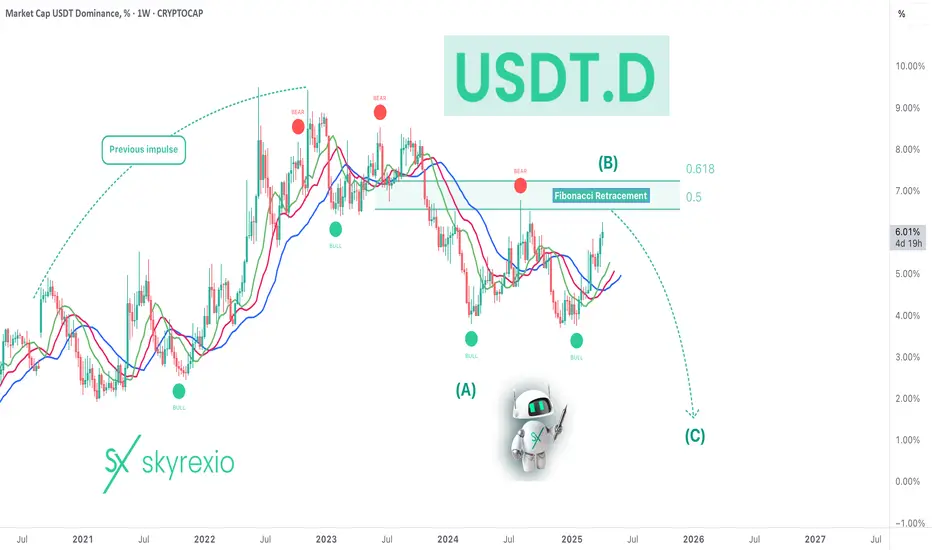
USDT Dominance Confirms Bull Run ContinuationHello, Skyrexians!
Yesterday we shared the analysis when told you that the first confirmation of altcoin season has been received. For sure, Bitcoin dominance still has not confirmed reversal. Today we will show the third important chart. CRYPTOCAP:USDT.D also can help us to predict altseason.
Let's take a look at the weekly chart. Tether dominance has been in the large uptrend wave and now it's in the major correction. Wave A has been finished, wave B has the flat shape and it's also almost done. Fibonacci target area has been almost reached. We want to see the red dot on the Bullish/Bearish Reversal Bar Indicator as a huge confirmation, but it's not obligatory.
Best regards,
Skyrexio Team
___________________________________________________________
Please, boost this article and subscribe our page if you like analysis!
Altcoin Recovery Depends on This USDT Dominance BreakAltcoins have taken a heavy hit — many are down 60–80% from their highs.
As seen in the USDT Dominance chart, we're still respecting the rising trendline. Until this trend breaks to the downside, pressure on altcoins may continue.
Key Zone to Watch:
Once USDT.D breaks below that rising support line and sustains a move lower, we could witness a strong recovery phase across the altcoin market. That shift will likely signal renewed confidence and capital rotation into risk-on assets.
Stay patient: The breakout is brewing. When that trendline cracks, altseason could ignite fast.
Keep your watchlists ready. The reversal will reward the prepared. 🚀
Like and drop a comment if you found our analysis helpful — your support keeps us going!

Bitcoin's Wild Ride: Will It Moon or Crash and Burn?Ah, Bitcoin—the digital rollercoaster we all love to hate. Currently lounging around $84,000 , but what's next? Let's dive into the crystal ball of crypto predictions, shall we? 🔮
The Bullish Dreamers:
Derivatives Delight: Some analysts are giddy over derivatives metrics, suggesting Bitcoin is "poised" to reclaim the $90,000 level in the coming weeks. Because who doesn't love a good gamble?
The Bearish Realists:
Death Cross Drama: Hold onto your hats! Bitcoin is flirting with a "death cross," where the 50-day moving average dips below the 200-day. Historically, this is like the crypto version of a horror movie—cue the dramatic music.
Support Level Shenanigans: If Bitcoin can't muster the strength to stay above $81,000, we might be sliding down to $76,000 faster than you can say "HODL."
The Fence-Sitters:
FOMC Follies: All eyes are on the upcoming Federal Open Market Committee meeting. Will they hike rates? Will they cut? Will they order pizza for lunch? Their decisions could send Bitcoin on a joyride or a nosedive.
So, what's the takeaway? Is Bitcoin gearing up for a moon mission, or are we strapping in for a freefall? As always, keep your wits about you, and maybe a parachute handy. 🎢🪂
If you want the deeper breakdown (the one nobody’s telling you), drop a comment or DM me. Maybe I’ll let you in on the real insights. 👀🔥
Disclaimer: This is not financial advice. Always do your own research before diving into the crypto abyss.

USDT at the critical resistancethe USDT dominance is at a very important & multi resistance area.
it does have trendline resistance & 61% of Fibonacci retracement , and looks like we have a bearish divergence on weekly RSI for it as well.
with a weekly candle rejection we might see a rally for cryptos IMO.

USDT Dominance Holding Strong – Altcoin Rally Soon?CRYPTOCAP:USDT Dominance chart shows an uptrend, respecting the rising support line and holding above the 50 EMA. Key levels include strong resistance at 5.40%, mid-support at 4.70%, and strong support at 3.70%.
A breakout above 5.40% could signal altcoin weakness, while a rejection and breakdown below 4.70% may lead to an altcoin rally.
Watch these levels closely—altseason or sell-off? The next move will decide!

When Bitcoin Goes Up, Tether Dominance Goes Down!I was wondering, does the Tether Dominance (USDT.D) index chart supports a bullish Bitcoin and a bullish Altcoins market? It does. Let's look at this chart together.
Bullish volume has been dropping steadily. Bearish volume is very high.
Tether Dominance has been in a downtrend, lower highs, since August 2024. Obviously, when Bitcoin hit bottom, USDT.D peaked. This index has been producing lower highs since. There is a clear downtrend on the chart.
A bearish hammer came on the 28-Feb. session. This is followed by another bearish signal 4-March. A continuation. Lower highs long-term and lower highs short-term.
The chart is pointing lower, has been going lower and will continue lower. This means that Bitcoin is going up.
Thank you for reading.
The signals are everywhere.
Namaste.
