OptionsMastery: Daily Resistance on TGT!🔉Sound on!🔉
📣Make sure to watch fullscreen!📣
Thank you as always for watching my videos. I hope that you learned something very educational! Please feel free to like, share, and comment on this post. Remember only risk what you are willing to lose. Trading is very risky but it can change your life!
TGT

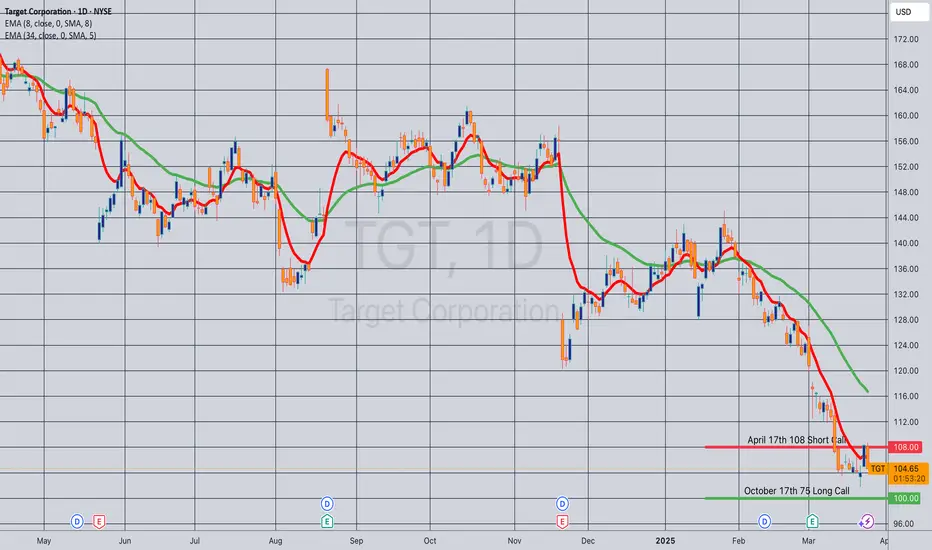
Opening (IRA): TGT April 17th -108C/October 17th 75C LCD*... for a 30.05 debit.
Comments: At or near a 52-week low. Buying the back month 90 delta and selling the front month strike that pays for all of the extrinsic in the long. (The 75C is shown at the 100 strike so that it fits on the chart).
Metrics:
Buying Power Effect: 30.05
Break Even: 105.05
Max Profit: 2.95
ROC at Max: 9.82%
50% Max: 1.48
ROC at 50% Max: 4.91%
Will generally look to take profit at 50% max and/or roll the short call at 50% max to lower my downside break even.
* -- Long Call Diagonal.
Did $TGT trigger a Bullish Divergence or is it just a Bull Trap?NYSE:TGT appears to have found support in the $100 - $105 range. I’ve been monitoring the stock and noticed a significant surge in institutional buying volume during the latter half of Friday’s session (3/21/2025), with nearly 32 million shares traded. The last time we saw such an unusual spike in volume, it triggered a gap-up and a sustained rally from 11/2023 to 4/2024.
A particularly notable development is the sharp increase in call option activity when the price dipped to the $101.xx zone early in the session. Both premiums and implied volatility (IV) spiked higher than usual. Additionally, MACD is on track for a bullish crossover by the final week of March 2025, while RSI, currently in the oversold zone, is showing signs of a recovery with a bullish divergence forming.
If Monday (3/24) and Tuesday (3/25) close green, expect selling pressure on Wednesday and Thursday. Friday (3/28/2025) will be a decisive session to determine whether Target can rebound toward $110 - $120 - $130.
However, Bearish on Weekly is the main trend, also keep in mind that Trump’s tariffs are still looming, with the next deadline set for Canada & Mexico is 4/2/2025. Don’t expect another extension. If you’re in profit, consider closing positions in this week. If Target fails to hold the $100 - $105 support zone, the next destination could be $90.
Disclaimer.

Target | TGT | Long at $105.75Target NYSE:TGT
Strengths:
P/E: 11.82x
Earnings are forecast to grow 4.95% per year
Dividend: 4.24%
Better "value" compared to others (i.e. NYSE:WMT )
Insiders recently awarded options
May have double-bottomed (see weaknesses below...)
Weakness
Economic headwinds / recession concerns
Debt-to-equity: 1.09x (slightly high)
Several price gaps on the daily chart are open below the current price. If recession fears are valid and news to messages "tighter consumer spending", these gaps will likely be filled (all the way down to the GETTEX:50S ). One day these will be filled, but that would be a huge opportunity for long-term investors...
Thus, at $105.75, NYSE:TGT is in a personal buy zone.
Targets
$119.75
$137.00
$150.00

$TGT: Target Corporation – Retail Titan or Fading Star?(1/9)
Good evening, shoppers! 🌙 NYSE:TGT : Target Corporation – Retail Titan or Fading Star?
Target’s at $116 on March 4, 2025—is this a golden ticket or a clearance rack trap? Let’s unpack the cart and find out! 🔧
(2/9) – PRICE PERFORMANCE 📊
• Current Price: $ 116 as of Mar 4, 2025 🤑
• Past Peek: Down 20% from $145.65 earlier this month 📉
• Sector Vibe: Retail’s feeling the squeeze, folks 🎮
It’s a bumpy ride, but deals might be hiding! 🛠️
(3/9) – MARKET POSITION 📈
• Market Cap: Roughly $53.15B (458.21M shares) 🏬
• Footprint: Around 1,950 stores, online sales popping 📡
• Trend: Brand loyalty high, but rivals are circling 🛡️
Still a heavyweight in the retail ring! 🏋️♀️
(4/9) – KEY DEVELOPMENTS 🔑
• Retail Scene: Spending’s tight, consumers picky 📅
• Digital Gains: E-commerce up, per past trends 🖥️
• Market Buzz: $116 hints at cautious buyers 🎤
Pivoting fast, but aisles are jammed! 🧭
(5/9) – RISKS IN FOCUS ⚠️
• Rivals: Walmart, Amazon playing hardball 🚨
• Economy: Inflation biting, tariffs looming 💸
• Swings: Retail stocks dance to a wild beat 🎶
Rough waters, but storms pass! 🌪️
(6/9) – SWOT: STRENGTHS 💥
• Name Value: Trendy goods, solid rep 💎
• Reach: 1,950+ stores, wide net 🗺️
• Online Edge: Digital sales climbing 📱
Loaded with ammo for the retail fight! 🔥
(7/9) – SWOT: WEAKNESSES & OPPORTUNITIES 🧐
• Weaknesses: $116 shows hesitation, margins tight 📋
• Opportunities: Push Target Circle, grow e-sales 🚀
Can it snag the prize or just scrape by? 🤷♂️
(8/9) – 📢Target’s $116, retail’s shaky—your call? 🗳️
• Bullish: $130+ soon, undervalued 🚀
• Neutral: Holding steady 🚬
• Bearish: $100 coming, trouble ahead 🕳️
Drop your vote below! 👇
(9/9) – FINAL TAKEAWAY 🎯
Target’s $116 price paints a shaky picture 📈, but its brand’s a rock 🌎. Swings are our playground—dips turn into DCA wins 💰. Buy low, aim high! Hit or miss?

Target Corporation (NYSE:TGT) To Report Earnings Before the BellTarget Corporation (NYSE: NYSE:TGT ) a company that operates as a general merchandise retailer in the United States is set to report earnings on Tuesday, March 4, 2025, before market open. In like of that manner, NYSE:TGT shares surge 2.27% in Tuesday's premarket trading.
With the 1-month low acting as a support point, in the case of a pullback the 1-month low seems strong enough to hold off sellers. With the RSI at 40, a bullish reversal could be feasible in the case of a favourable earnings outlook.
Financial Performance
In 2023, Target's revenue was $107.41 billion, a decrease of -1.57% compared to the previous year's $109.12 billion. Earnings were $4.14 billion, an increase of 48.85%.
Analyst Forecast
According to 31 analysts, the average rating for TGT stock is "Buy." The 12-month stock price forecast is $159.45, which is an increase of 32.04% from the latest price.

Target 134.61Following weekly chart.
I got a long signal from one of my power indicators.
I'll only bet for close resistance.
TP1 134.61 which is first resistance
TP2 139.3 next critical fibo level.
I'd stop under 129.23 candle close. RR is perfect.
Let me know if you ride it

Major Price Movement Incoming for TGT!Signalist has detected a precise pattern in NYSE:TGT trading activity, signaling that a substantial price movement is imminent. This isn’t a random fluctuation—it’s a carefully analyzed precursor to a significant market event.
📅 What to Expect:
⌛ Timeline: Anticipate a major move within the next 1 to 4 upcoming 3-hour candles.
📈 Monitor the Charts: Keep an eye on TGT’s price action over the next few candles.
Prepare Your Strategy: Whether you’re bullish or bearish, have your trading plan ready to capitalize on the move.

TGT | SHORTNYSE:TGT
Technical Analysis of Target Corporation (TGT)
Key Observations:
Current Price Action:
Price: $139.17
Recent Drop: -7.85 (-5.34%)
Support and Resistance Levels:
Immediate Support: $137.16 (Bearish Line)
Further Supports: $128.21 (Target Price 1), and $111.08 (Target Price 2)
Resistance: The price recently broke below a support level at around $141.23.
Trendlines:
The price has broken below a key upward trendline, indicating a potential shift from a bullish to a bearish trend.
Relative Strength Index (RSI):
Current RSI: 44.09
The RSI shows a decline, approaching the oversold zone, indicating increasing selling pressure.
Target Prices:
Target Price 1: $128.21
This level is the immediate support and a potential first target for any continued downward movement.
Target Price 2: $111.08
If the price breaks below the immediate support, the next target is around $111.08, a significant support level.
Summary:
Target Corporation (TGT) has experienced a significant drop, breaking below a key support level and its upward trendline. The next levels to watch are $137.16, $128.21, and $111.08. The RSI indicates potential for further declines if market conditions remain negative.

Target (TGT): A Buying Opportunity in the GapAfter three months of waiting and planning this setup on NYSE:TGT , we are finally buying shares following the recent drop into the desired breakout gap. Before this move, the stock hovered around the Point of Control (POC), making a breakout in either direction inevitable. This decline now provides a more favorable risk-to-reward ratio, setting us up to aim for the all-time highs once again.
If the level of wave (4) is breached, we will need to reassess our bullish outlook and consider a potential deeper correction. However, the setup remains promising as the 78.6% and 88.2% Fibonacci retracements align perfectly with the lower edge of the gap.
Historically, NYSE:TGT ’s oversold RSI since 2019 has led to a minimum 50% pump in four out of six cases, further solidifying our bullish view. The next critical level to watch is $180—reclaiming this resistance will be crucial for continued upward movement. Until then, we will stay patient and monitor the situation. ✅

Big pattern of TGT! 🔉Sound on!🔉
Thank you as always for watching my videos. I hope that you learned something very educational! Please feel free to like, share, and comment on this post. Remember only risk what you are willing to lose. Trading is very risky but it can change your life!

looking at some of the Consumer discretionary names in headlineslooking at some of the Consumer discretionary names in headlines, some of these names are getting lot of publicity for right or wrong reason.

TGT - ThorwalletDEX - vultisig - banana!Even a child sees that there is a big banana in the making :)
Do some research and look up the tokenomics and the fundamentals behind the potential upcoming banana.
I don't set any short term targets for this token (before upcoming merge), but I predict success, and the chart suggest so.
#payment solutions
#revolutionary wallet
#native assets

ThorwalletDEX (TGT) ThorwalletDEX!!!
This is just idea and not a financial advice. If you like low caps with huge upside/risk, this one is for you.
Zoom in on daily time frame. Do your own research. Don't just buy low market cap coins.
This chart tells me one simple reason to buy TGT - the chart looks super super bullish.
I've been bullish on ThorwalletDEX for a long time.
It's more than the fundamentals that speak to me, everything is align.
I will not give any price targets, I have no clue, but I really think TGT can explode.
TGT is a superb App/DEX, 16 million dollar market cap, cross chain!
I don't now what I have missed, it's seems so wrongly priced!

What Wall of Worry? Path of Least Resistance for NowI reviewed an interesting study Tuesday about V bottoms. Over 20 years of data showing the average "V Bottom" takes nearly 1 year to come back and get into positive territory.
The fact that all US Indexes and many stocks have done this in 10-15 trading trades is pretty remarkable. Will we more path of least resistance at all-time highs or will we see resistance actual hold for a beat.
All US Markets closing green today, Russell 2000 led the indexes today with +1.30%
DXY hitting fresh lows, but 101 and 100 are major technical support levels that I'm watching.
Review at your convenience. Thanks for watching!!!

Target’s Q2 Triumph: Earnings Beat, Surging Stock, & OutlookKey Takeaways:
- Target (TGT) shares surged over 13% after a strong Q2 earnings report.
- The company’s revenue and net income outperformed expectations, driven by increased store traffic and digital sales.
- Target raised its full-year EPS guidance, reflecting confidence in sustained growth.
A Strong Quarter Amidst Challenges
Target Corporation ( NYSE:TGT ) has delivered an impressive performance in its second quarter of fiscal 2024, surprising analysts and investors alike with stronger-than-expected earnings and a positive outlook for the remainder of the year. The retailer’s stock soared over 13% in pre-market trading on Wednesday, signaling renewed investor confidence in the company’s growth strategy.
Target ( NYSE:TGT ) reported second-quarter revenue of $25.42 billion, a 2.6% year-over-year increase, surpassing Wall Street’s expectations. Even more noteworthy was the 40% jump in net income, which reached $1.19 billion, a significant improvement from the previous year’s quarter. This robust financial performance is a testament to Target’s successful cost-cutting measures and strategic investments in key growth areas.
Driving Growth: In-Store Traffic and Digital Sales
One of the most encouraging signs from Target’s Q2 report was the return to growth in comparable store sales. After experiencing a year-over-year decline in the first quarter, comparable store sales rebounded with a 2% increase. This growth was fueled by a 3% rise in in-store traffic and an impressive 8.7% surge in digital sales.
Target’s ability to drive both physical and online traffic highlights the effectiveness of its omnichannel strategy. The company’s same-day services, including curbside pickup and same-day shipping, were particularly successful, contributing to double-digit growth in these areas. Additionally, discretionary sales trends showed meaningful improvement, with categories like apparel and beauty leading the charge.
Raising the Bar: Upgraded Profit Outlook
Buoyed by its strong second-quarter performance, Target ( NYSE:TGT ) has lifted its full-year earnings per share (EPS) guidance. The company now expects full-year EPS to range between $9.00 and $9.70, up from the previous forecast of $8.60 to $9.60. This upward revision reflects Target’s confidence in its ability to navigate ongoing economic challenges while continuing to deliver value to its customers.
For the third quarter, Target ( NYSE:TGT ) projects flat to 2% growth in comparable sales, with EPS expected to range between $2.10 and $2.40. Despite a cautious outlook on sales growth, the company’s profitability remains strong, underscoring its resilience in a competitive retail landscape.
Value-Driven Strategy in a Competitive Market
During an interview on CNBC’s “Squawk Box,” Target CEO Brian Cornell addressed concerns about inflation and price gouging in the retail industry. Cornell emphasized that Target operates in a “penny business,” with thin profit margins that leave little room for price inflation. He highlighted Target’s commitment to providing value to customers, a strategy that has resonated well in an environment where consumers are increasingly budget-conscious.
In response to shoppers’ concerns about rising prices, Target has implemented strategic price cuts on thousands of everyday items, including essentials like diapers and peanut butter. This approach has successfully driven higher traffic to Target’s stores and website, with the company reporting a 3% increase in customer traffic during the quarter.
Cornell’s comments reflect Target’s broader strategy of appealing to consumers who are carefully managing their budgets. By focusing on value and competitive pricing, Target has positioned itself as a retailer of choice for price-sensitive shoppers, even as inflationary pressures persist.
Financial Strength and Strategic Investments
Target’s strong financial performance in the second quarter is also reflected in its operating results. The company’s operating income margin rate increased to 6.4%, up from 4.8% in the same period last year. This improvement was driven by higher gross margins, which benefited from cost improvements that more than offset higher promotional markdown rates.
In addition to its earnings performance, Target ( NYSE:TGT ) continued to deploy capital strategically. The company repurchased $155 million of its shares in the second quarter and paid $509 million in dividends, reflecting its commitment to returning value to shareholders. Target’s after-tax return on invested capital (ROIC) also improved, reaching 16.6% for the trailing twelve months, compared to 13.7% in the previous year.
Conclusion: A Retailer on the Rise
Target’s second-quarter results underscore its resilience and adaptability in a challenging retail environment. The company’s strong earnings, improved profit margins, and upgraded full-year guidance signal that Target is well-positioned to continue its growth trajectory. As it navigates the complexities of inflation and changing consumer behavior, Target’s focus on value, digital expansion, and strategic investments will be key drivers of its success in the coming quarters. Investors and market analysts will undoubtedly be watching closely as Target continues to execute on its growth strategy.

TGT Target Corporation Options Ahead of EarningsIf you haven`t sold the speculative bubble:
Now analyzing the options chain and the chart patterns of TGT Target Corporation prior to the earnings report this week,
I would consider purchasing the 135usd strike price Puts with
an expiration date of 2025-4-17,
for a premium of approximately $9.80.
If these options prove to be profitable prior to the earnings release, I would sell at least half of them.

Target (TGT): Ready to Break Out of Its DowntrendWith Target, we have another major player in the US retail market, and we prefer its price structure over Walmart's. After completing Wave (3), Target experienced a significant sell-off, forming Wave (4). Currently, it appears that an inverse head and shoulders pattern is developing, which could signal a bullish reversal. The neckline looks particularly strong, and I will have a bullish outlook once this neckline is reclaimed.
There is a breakout gap following the completion of Wave (4), which might be revisited. However, for a well-formed head and shoulders pattern, we should see some momentum soon to create two shoulders at the same level. As long as the Wave (4) level at the Point of Control (POC) holds, we expect more upside, either after a slight dip into the breakout gap or immediately following the earnings report next week.


Target Shares Slides 7.38% After Inflation Hurts EarningsTarget's first-quarter earnings and sales fell by 7.38% due to inflation, causing shares to fall in pre-market trading. Adjusted earnings per share were $2.03, down from $2.05 year on year and worse than analysts expected. Total revenue was $24.53 billion in the first quarter ended May 4, down 3.1% from $25.32 billion in the same period last year. First-quarter comparable sales were down 3.7%, marking the fourth straight quarter of decline. The slowdown in sales was primarily in discretionary categories like home decor and electronics but partially offset by a continued growth in beauty. Target's net income came in weaker, at $942 million compared to $950 million in the same quarter in 2023.
The number of transactions and average amount spent at Target stores ( NYSE:TGT ) and digital channels were both down 1.9% in the first quarter, compared to a traffic growth of 0.9% and a decline of 0.9% in average transaction amount in the comparable period last year. Target stock was down more than 9% to about $141 per share in Wednesday’s pre-market trading, following Wednesday’s report.
Target's ( NYSE:TGT ) revenue fell slightly last year for the first time in seven years following a weaker growth in visitor numbers that hit retail businesses across the United States. In March 2024, the big-box retailer re-introduced its free loyalty program, Target Circle, and launched a paid membership program that allows customers to get free same-day delivery on orders over $35 in as little as an hour at $99 a year. These initiatives were aimed to stimulate demand and rival existing paid membership programs by Amazon Prime and Walmart+.
Target shares ( NYSE:TGT ) slipped ahead of markets opening Wednesday after the retailer reported first-quarter results, with revenue meeting expectations but declining 3% year-over-year. Despite posting a slight earnings beat for the quarter, Target's second-quarter and full-year profit guidance ranges were mostly below estimates. The company said it is still feeling the impact of shoppers lowering their discretionary spending, but added that "discretionary sales trends continued to improve" from previous quarters.

Thorwallet DEX (TGT) - time to rocket soon?!Thorwallet DEX has been building for years now.
It may seem irresponsible to recommend a coin with such a low market cap as 22 million, but…
The chart speaks for itself. It points upwards. Even in a sideways market. Something is cooking!?
The strong connection to Thorchain could also be extremely positive for the price in a bull market.
I see Thorwallet as a bargain with such a unique product.
Even if the risk is high risk. I think it could be a nice time to look deeper into what Thorwallet DEX is - before a possible explosion in price.
If you have high conviction in Thorchain - TGT could be something to look deeper into!
DCA and wait for marketing, exchange listings etc.th..
Non financial advice - high risk token with great potential if everything works out well!

$TGT looking for a bounce after the gap fillTGT looking to go back north after the gap fill and now its breaking that downward trend line. Something to keep on your radar.

TARGET $TGT - Mar. 25th, 2024TARGET NYSE:TGT - Mar. 25th, 2024
BUY/LONG ZONE (GREEN): $170.50 - $184.00
DO NOT TRADE/DNT ZONE (WHITE): $163.25 - $170.50
SELL/SHORT ZONE (RED): $150.25 - $163.25
Weekly: Bullish
Daily: Bullish
4H: Bullish
NYSE:TGT had strong bullish momentum on March 5th, we saw a slight pullback after with steady bearish structure on the 4H timeframe, and then a break back above structure to create a new bullish zone to begin looking for entries. The DNT zone is marked in the event of a breakdown of the bullish structure. The bearish trend would begin at the bottom of the overall structure of the previous bear leg.
This is what I would personally look at before entering trades, everything is subject to change on a daily basis and as I analyze different timeframes and ideas.
ENTERTAINMENT PURPOSES ONLY, NOT FINANCIAL ADVICE!
trend analysis, technical indicators, support and resistance, targetstock, tgtstock, NYSE:TGT , tgt, target, retailstocks, supermarketstocks, walmart, costco, NYSE:WMT , NASDAQ:COST , targetanalysis, targettrend, targetlong, targetshort,
