Thailand
STARK moving up in the squareStack did a small breakout with volume.
Now should be moving to the new trend line.
Green day after drawing back to both MV. AVG 12 and the trend line is a good buying point.
Easy stop-loss position - 2.20 on the trend bottom.
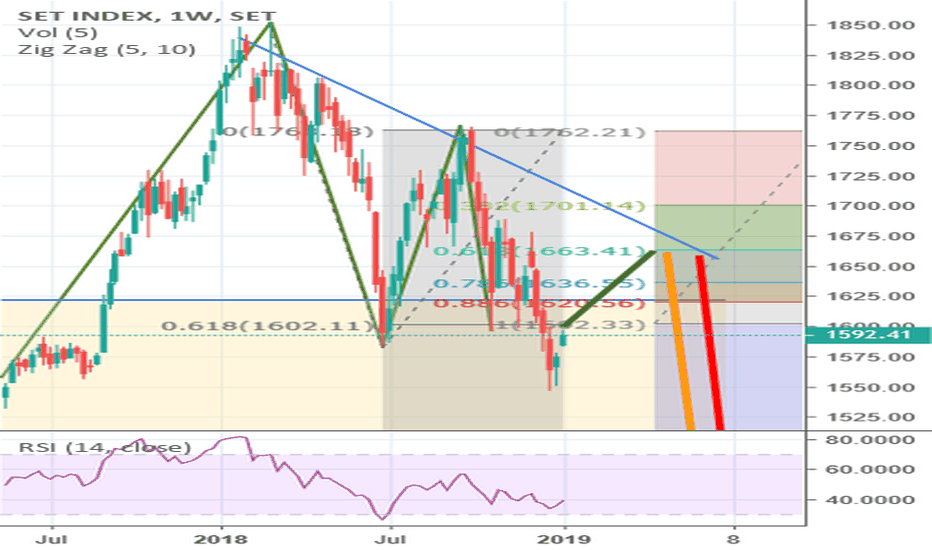
SET Index to hit 2-year new low (Weekly Chart)After SET index breakout 5 years channel at 1600.00, it retested to 1600.00 support line and showed the weakness breakout as long red and short green candles.
It dipped a little new low at 1590.00 so this notices the bearish sign of lower high and lower low.
Forecast : Bounce to 16500.00 and plummet to 1500.00/1350.00
[SET INDEX TH] possible drops more in coming weeksWe can see LH and LL printing on the weekly chart.
There is also a lot of uncertainty about the election result.
Possible drop to the previous support zone (~1550)
If this zone breaks, very likely to send us to ~1500 and bounce there.
Going back above 1680 will invalidate this.
Good luck trading!
Stay safe!
SET50, still downtrended ?April 4, 2019
SET50 of Thailand, still downtrended beneath the RED downtrend line.
Once she retraced to 50% fibonacci retrecement (1073), then rebounded.
The major stochastic reached OVERBOUGHT and the bearish divergent was found on the minor stochastic (the light blue arrows), watch out for going down to 61.8%(1063) and 78.6%(1049) fibonacci retrecement.
.....
recognized virtues for #WaveRiders
USDTHB Downward Trend Continues The Thai baht over the past week started out the week sideways, but like the Singapore dollar ended the week up. This pair is a bit more impacted recently from political risk surrounding its election and because of this we may see more volatility not related to technical or fundamental components. Nonetheless, its important to keep in mind the overall trend remains downward sloping and a continued weakening of the US dollar. Moreover, price action remained in theshort-term trend line resistance range at the week's end reinforcing the notion that linear downward resistance is difficult to break. Additionally, the technical picture for USDTHB over the next week looks like it could revert back to the mean where RSI points towards overbought and the bull bear indicator suggests USDTHB long is overcrowded. Meanwhile, exponential moving averages also suggest continuation of our downward trend. In sum, USDTHB is still short.
For more of my analysis, please check out www.anthonylaurence.wordpress.com
USDTHB Stalled Momentum, Still Trends DownOrdinary least squares method suggests we are still trending down in this pair even as many other Southeast Asian currencies are trending much further down such as USDSGD as can be seen here: In that respect, Thailand is an under-performer, but momentum has stalled even though some of the technicals are pointing towards a bit of an upward rebound. However, I am of the view that we still need to trend down a bit more before this sentiment can be achieved.
If you are interested in any more of my analysis that focuses on foreign exchange and equities, please check it out here anthonylaurence.wordpress.com
#BDMS - Breakout Alert Rectangle Chart PattenBreakdown of the rectangle chart pattern in BDMS
Bangkok Dusit Medical Services Public Co. Ltd. is dedicated to the health care business. The company operates through two segments: Hospital Operations and Other Businesses. The value is listed on the Stock Exchange of Thailand.
The BDMS price developed a rectangle chart pattern of possible distribution zone, of almost 8 months duration. I do not consider this pattern as a Head and Shoulders, although the volume follow its characteristics, but the closing prices, without bear the wicks in mind, the left shoulder and the head have the same level. Also, the upper boundary acting as strong resistance at 27.3 levels and the lower boundary acting as strong support at 24 levels. Both limits have been tested several times before the breakdown. The price has broken the uptrend line of 1 year and 7 months in addition the price action below the 200-day average.
- A daily close below 23.3 levels, confirms the breakdown of the pattern.
- The possible target price of the chart pattern is at 20.8 levels.
Please, don't forget to leave your LIKE if you appreciate this, it helps to keep sharing :)
Note: The entry and exit levels are references according to the principles of classical charting. Each trader must take their own decisions depending on their strategy and risk of entry and exit. These levels do not indicate specific entry and exit prices, only possible changes in the technical price action.
PTT (SET Index Thailand) Using the basically technical analysis (Support and Resistance) and fundamental. I expected the price of PTT will go up in the short term depend on the oil price. Based on the oil price, now the price of it also touched the resistance at 42.20 US per Barrel in D time frame then the price go up to approximately 48.20 because of OPEC. Now we should looking closely at the price of WTI on Monday morning to support the technical analysis. If the price continue go up, it will the good opportunity to long position (Don't forget your money management because there is no one know exactly about price in Stock market). Happy trading everyone.


