ACE is going down
ACE is long way for the uptrend and now ready to goes down. The stock came to its New Year Resistance and have a very hard time to pass through this wall.
With the Bearish Divergence, Multiple fault Big Volume breakouts and the Weak Momentum in Week graph, the stock could goes down for awhile.
The idea is to just short arond here and stoploss at 3.82 /OR/ wait for the breakdown the blue line at 3.60 and stoploss at 3.74 .
The first target price is its last base at the green line around 3.12
Thaitrader
SET is still make everyone like on a Dance floor (Hard Sideway)
SET is still in a very hard sideway and ready for the explosive Up or Down trend.
The idea is to waiting for the breakout of either way and if the retrace isn't getting back to the old sideway range. That's the real good time for the Huge $$$ :)
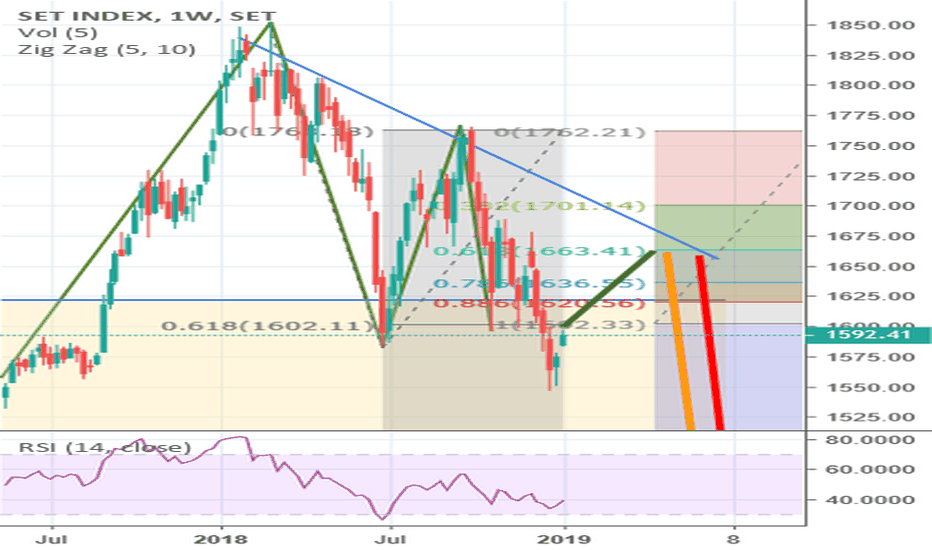
SET Index to hit 2-year new low (Weekly Chart)After SET index breakout 5 years channel at 1600.00, it retested to 1600.00 support line and showed the weakness breakout as long red and short green candles.
It dipped a little new low at 1590.00 so this notices the bearish sign of lower high and lower low.
Forecast : Bounce to 16500.00 and plummet to 1500.00/1350.00
USDTHB hits the support of channel | a good long opportunityThe priceline of USDTHB is moving within an Up channel and hits at the channel's support.
The MACD is turning bullish.
RSI is oversold.
Stochastic is oversold and gave bull cross.
The sell targets are as below:
Short between: 30.912 to 30.966
Regards,
Atif Akbar (moon333)
USDTHB Downward Trend Continues The Thai baht over the past week started out the week sideways, but like the Singapore dollar ended the week up. This pair is a bit more impacted recently from political risk surrounding its election and because of this we may see more volatility not related to technical or fundamental components. Nonetheless, its important to keep in mind the overall trend remains downward sloping and a continued weakening of the US dollar. Moreover, price action remained in theshort-term trend line resistance range at the week's end reinforcing the notion that linear downward resistance is difficult to break. Additionally, the technical picture for USDTHB over the next week looks like it could revert back to the mean where RSI points towards overbought and the bull bear indicator suggests USDTHB long is overcrowded. Meanwhile, exponential moving averages also suggest continuation of our downward trend. In sum, USDTHB is still short.
For more of my analysis, please check out www.anthonylaurence.wordpress.com
USDTHB Stalled Momentum, Still Trends DownOrdinary least squares method suggests we are still trending down in this pair even as many other Southeast Asian currencies are trending much further down such as USDSGD as can be seen here: In that respect, Thailand is an under-performer, but momentum has stalled even though some of the technicals are pointing towards a bit of an upward rebound. However, I am of the view that we still need to trend down a bit more before this sentiment can be achieved.
If you are interested in any more of my analysis that focuses on foreign exchange and equities, please check it out here anthonylaurence.wordpress.com
RS : Long position at 21.4 to TP24.0 (expected 12%)Trend was likely to be reversal when it shows two higher bottom and 19.0 breakout with peak volume and a gap up afterwards. This is kind of the uptrend confirmation. The target are predicted from the cluster of Fibonacci extension and projection which accidentally equal the peak volume price level in the past months.
Beauty : Long position as in mark up phase 02Assume selling climax in July 2018 and accumulated for 26 bars. Then it did breakaway gap and marked up(01) for 30% approx. Again, it accumulated for shorter period for 16 bars and later did the breakaway gap which assuming this is in the mark up phase(02). Hopefully, it will reach 30% as a minimum next TP that should not be less that mark up phase(01). Nevertheless, period of 7 bar for the mark up phase should be considered.
My TP is 14.00, 17% from the current price 11.90. Stoploss is at 11.30(-5%).
I will be aware of the volume divergence on the uptrend since mid Aug2018.
USD/THB 4H Chart: Breakout form triangle USD/THB 4H Chart: Breakout form triangle
The American Dollar was trading against the Thai Baht in a two-week long symmetrical triangle. In result of the previous trading session the currency rate made a breakout to the bottom. The bearish movement is not evident yet. Nevertheless, the slipping 55- and 100-period SMAs together with the weekly PP suggest that sudden surge is unlikely.
However, in larger perspective the soar is expected to continue, as in the end of November the pair made a rebound from the lower trend-line of a four-month long descending channel. An upcoming decision on the US interest rate hike as well as growing economy also point out in favour of further appreciation of the buck.
To certain extent, market sentiment confirms this assumption, as 72% of traders are bullish on pair. However, such common view might be also a signal of the upcoming turnaround.


