Is a Breakout Imminent for #GRT or Another Bull Trap is Ahead?Yello, Paradisers! Are we looking at a clean breakout setup that could send #GRT flying or is this the perfect trap to wipe out early bulls? Let's see the latest #GRTUSDT moves:
💎The daily chart on #GRTUSD is showing a perfectly formed descending channel, with price now hovering just above the lower boundary—a zone that has consistently held as strong descending support. After multiple rejections from the upper boundary and rebounds off the lower trendline, the price has now shown its first serious signs of momentum since bottoming in the strong demand zone
💎This structure has been in play since early May for #TheGraph, with each bounce from the support line giving temporary relief, only for the price to get slapped down at the descending resistance. But this most recent bounce looks different—it’s happening directly above a well-defined demand zone between $0.0668–$0.0700, a level that has historically attracted strong buyer interest.
💎A breakout above the descending resistance trendline, ideally with a strong daily close above $0.085–$0.090, would invalidate the bearish pressure and likely trigger a sharp leg up. The mid-term resistance sits around $0.1032, and clearing that would open the door to a retest of $0.1318, a level that previously acted as a strong rejection zone.
💎If the price fails to reclaim the descending channel and rolls over again, especially losing $0.0668 on a daily close, the bullish structure would be invalidated. That would shift focus toward the support zone at $0.053, and if that breaks, the next target becomes $0.0300—a brutal drop that would liquidate most late longs and signal deeper downside.
Stay disciplined. The next big opportunity will come to those who wait, not those who chase.
MyCryptoParadise
iFeel the success🌴
Thegraph

Can the Graph chart a recovery rally into resistance?Quite a few multiples if it can!
Entires in the support band represent low risk entries
(compared to last cycles elevated valuation's)

GRT | Altcoins | MASSIVE UPSIDE Potential on The GraphAnother altcoin that has great upside potential is the Graph BINANCE:GRTUSDT
The Graph from a weekly perspective may seem like there's not much action, but if you zoon in to the daily timeframe we see a different picture.
WEEKLY:
VS DAILY:
We can see anything from a +40% increase to a -30% dip in just a few days; a picture that is lost when we look at the weekly. This is IDEAL for swing trading.
Once you've established the general direction from the MACRO, swing trades become very viable (spot). If your patient enough to wait for a few days, a +30% could easily be achieved within a two week timespan.
______________________
BINANCE:GRTUSDT

The Graph: Your Altcoin ChoiceCan The Graph really grow by 6,000% in 2025?
I don't know, seems like a lot but I also have some more conservative targets.
$2.04 can yield a huge 2,493% from current levels. This is GRTUSDT moving up and not hitting a new All-Time High in 2025. There is a long long-term higher low and higher lows tend to lead to higher highs, which means that an All-Time High is indeed possible.
Another conservative target sits at $1.18 for 1,400% from current levels. There are also several lower, short-term targets mapped on the chart.
The Graph peaked super early in 2021, in February. The rest of the market peaked in April, May and many pairs in November 2021. So this is almost erratic behavior. This is good for the long-term and for the 2025 bull market. When projects move in unique ways, it tends to be a positive.
The project has been solid and strong. The chart is also good with good price action, a nice design and reasonable growth. The action is happening now near the same levels as the September 2023 low support. From here, prices can grow.
It can take a few days, maximum several weeks for the start of the next bullish wave. May for certain but never beyond. In fact, the bottom might be in now and we are gearing up for up for months.
I will not give you more as this is enough... A full bull market can develop within 6 months. Sometimes it can take 12 months or 16 months, but at other times, a pair can produce all the action in less than 6 months. This might be one of those.
Be prepared.
Thank you for reading.
Feel free to leave a comment with your questions.
If you enjoy the content just follow.
Namaste.

GRT Main trend. 23 02 2025Logarithm. Main trend. Time frame 1 week (no need for less). Hype will be when they promote everything related to artificial intelligence. It may go against the general trend in this regard.
But, at the moment, behind the market, which is logical. I imposed dynamic support/resistance zones of the Gann fan for orientation with the intersection of ordinary key levels (as everyone sees). I showed formations that can be formed and key reversal zones, percentages to them.
Previous closed trading idea +311% / +890%
1️⃣exactly in the designated zones of the planned first “hamster pump” +311%
2️⃣and the maximum pump (planned dump zone) 700-900%
GRT/USDT Main trend. Descending wedge. 8 02 2023
Local trading situation now.
Locally, after collecting long stop-loss at a large % (-27), this zone is held. If the market as a whole is positive, then this zone with 3 trend support points will be the main support for the development of the upward trend.
If this zone is broken, and the price consolidates below the “neck” level, then a decline to the 0.78 zone, that is, the formation of a descending wedge in the secondary trend. There will be a “double bottom” globally. Then, a breakthrough of the wedge resistance, and aggressive pumping under the hype of all that sort of thing.
Scam. Unlikely . Lower declines (implementation of "head and shoulders" without a squeeze) — the likelihood of a scam, that is, tales of hacking and "closure of the project". What is unlikely is how the project is traded in the US on Coinbase, and for this there are consequences for the creators.

The Graph (GRT)🔷 Introduction:
What is GRT?
The Graph (GRT) is a decentralized protocol designed for indexing and querying blockchain data. It enables developers to access blockchain information quickly and efficiently without the need to run dedicated servers. GRT serves as the native token of this ecosystem, used for transaction fees and securing the network.
🔹 Technical Analysis of GRT/USDT – Weekly Timeframe
📌 Overall Market Condition
After an extended corrective phase, GRT remains within its weekly ascending channel. The price is currently hovering around a key support zone (0.1165 - 0.1334, marked in blue), which has historically triggered significant reactions.
🔍 Potential Scenarios
📈 Bullish Scenario:
✅ If the blue support holds and the price re-enters the ascending channel, further upside potential is likely.
✅ Key resistance levels:
Orange Zone (0.3202 - 0.3577): Possible initial reaction level.
Red Zone (0.6423 - 0.7232): Major resistance before reaching the final target.
✅ Key Consideration: If weakness in momentum and declining volume appear near these resistance levels, gradual profit-taking and a cautious approach could be wise. Otherwise, continued bullish momentum could push the price toward the channel’s upper boundary, targeting 1.0667 - 1.2607 (light blue TP zone).
📉 Bearish Scenario:
❌ If the blue support fails, the price could drop towards the next major support zone at 0.0691 - 0.0816 (gray support).
❌ Losing this level would invalidate the bullish structure and increase the likelihood of deeper declines.
🎯 Entry Strategy & Risk Management
⚡ Gradual entry within the blue support zone with a stop-loss below the gray zone is recommended.
⚡ Suggested risk: 0.25% to 0.5% of spot capital (to prevent heavy losses).
⚡ Volume increase in this area could signal a potential trend reversal.
🔹 Conclusion
The current support level is critical for GRT. If it holds, the bullish scenario remains intact, allowing for potential growth toward the upper boundary of the ascending channel. However, losing this level could invalidate the bullish structure and lead to a deeper correction.
🔸 Additionally, when approaching key resistance levels (0.3202 - 0.3577 and 0.6423 - 0.7232), monitoring volume and price behavior is essential. Signs of weakness in these zones may indicate an opportunity for gradual profit-taking and a more cautious approach.

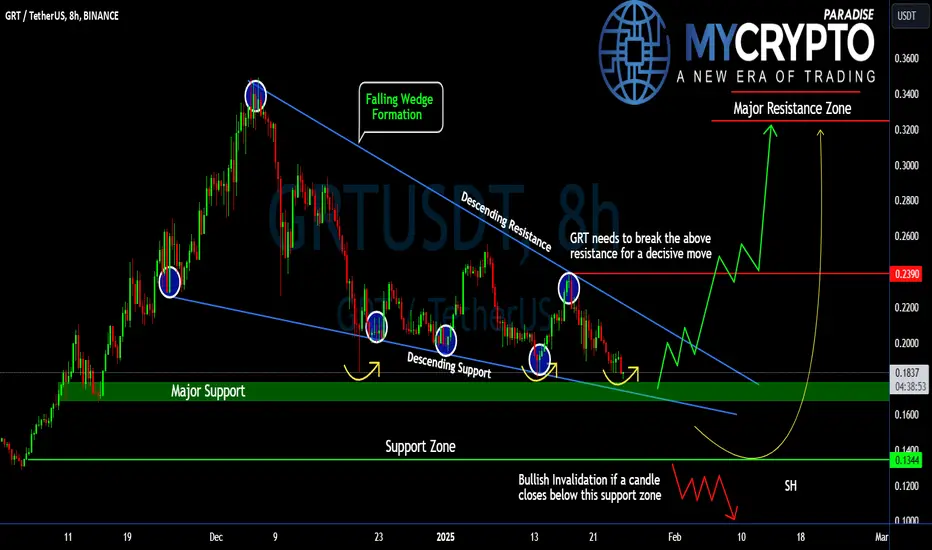
Will #GRT Finally Break Free From Its Falling Wedge? Key LevelsYello, Paradisers! Are we about to witness a bullish breakout for #GRTUSDT, or could this falling wedge formation drag the price further down? Let's look at the latest setup of #TheGraph:
💎#GRT is currently trading within a falling wedge pattern along with a triple bottom pattern established in an 8-hour timeframe chart and showing a high probability of a bullish reversal from its current trajectory. However, patience is key as a breakout confirmation is essential before taking any decisive action.
💎#GRTUSD is approaching a critical resistance zone near $0.239, which aligns with the upper boundary of the wedge. A breakout above this level would signal bullish momentum and could pave the way for a sharp rally toward the $0.32–$0.33 zone, where sellers are likely to step in.
💎On the downside, $0.17 has been acting as a solid support zone, with buyers stepping in to defend this level each time the price approaches it. As long as this support is in place, the bullish scenario will remain valid. However, if this support fails then the asset will fall to the $0.134 support zone where buyers are expected to step in.
💎However, if the price closes below $0.134, the bullish setup would be invalidated, and the price could slide toward $0.12 or even retest the $0.10 zone, where further demand is expected.
Stay focused, patient, and disciplined, Paradisers🥂
MyCryptoParadise
iFeel the success🌴
#GRTUSDT: Is a Major Breakout on the Horizon or a Breakdown?Yello, Paradisers! Are you ready for a decisive move of #GRTUSDT? Let's discuss the latest analysis of #TheGraph:
💎Currently, #GRT is at a crucial crossroads as it shows signs of bullish continuation from the key Bullish Order Block (OB) at $0.146. If the price can hold steady at this level, there’s a solid chance we could witness a breakout above the descending resistance of the ongoing channel. But momentum is everything here, and sustained buying pressure will be essential for this breakout to become a reality.
💎However, we're not in full breakout mode just yet. For confirmation, we need a decisive break above the internal resistance at $0.219, accompanied by strong engulfing candles and maintained momentum. Until we see that, it's wise to stay cautious and avoid jumping in too early. The market has been tricky lately, and waiting for the right signal could make all the difference between profit and loss.
💎If the bulls fail to push #TheGraph above $0.219, the momentum could shift back to the sellers. The critical support level to keep an eye on is still $0.146, which has been tested twice and held strong. A rebound from this level would keep the bullish outlook alive and potentially set the stage for another attempt to break higher.
💎But if $0.146 gives way, expect the price to target the major support zone between $0.113 and $0.125. Should #GRT fall to this range and fail to hold, the bullish scenario would be off the table, making it essential to adjust your strategy accordingly.
Trade smart, and stay patient! The real move is coming; make sure you’re on the right side of it.
MyCryptoParadise
iFeel the success🌴

TheGraph Protocol- The Graph Protocol is a decentralized indexing protocol for querying blockchain data. It allows developers to efficiently access and retrieve data from blockchains like Ethereum without building complex data-fetching solutions.
- When GRT was introduced, it was often referred to as the "Google of the Blockchain" due to its role in efficiently indexing and querying blockchain data, much like how Google organizes and retrieves data from the web.
- So, GRT is bullish like most altcoins but lagging. It needs to break out of this Yellow triangle to confirm upward momentum.
----------------------------------------------------------------------------------------------
Trading Part
----------------------------------------------------------------------------------------------
- Buy a breakout after 0.3$ ( and wait weekly candle confirmation )
- Wait for a dip and buy 0.15$-0.14$ (30% invest)
- full invest (add 70%) 0.05$
----------------------------------------------------------------------------------------------
Take profits
----------------------------------------------------------------------------------------------
- TP1 : 0.3$
- TP2 : 0.5$
- TP3 : ATH
----------------------------------------------------------------------------------------------
Long Term Bull Run TP : 7.5$ - 10$ Max
----------------------------------------------------------------------------------------------
Happy Tr4Ding !

THE GRAPH — 2024-5JSE:GRT is an open-source protocol that enables efficient indexing and querying on blockchains. Ethereum, Solana, Polygon are just a few of the 70+ chains on chains available to query on The Graph Network, and more are being added every month. Often called the “Google for blockchains,” The Graph allows developers to retrieve data from blockchains without relying on centralized servers or traditional databases. It also removes the need to self-host expensive data servers or rely on a full-time data team. This indexing capability is crucial for decentralized applications (dapps) to operate smoothly, as data needs to be accessible in real-time to offer users a seamless experience.
The Graph is pioneering a new data standard for web3 with GRC-20, a proposed common language for data across web3. Just as ERC-20 standardized value on Ethereum, GRC-20 will standardize data, information & knowledge and bring web3 to life.


The Graph (GRT)The Graph is an indexing protocol for querying data for networks like Ethereum and IPFS. GRT has a high growth potential and should keep an eye on it. It seems the downtrend phase is ended; after an upward impulse wave started price entered a corrective wave in a triangle-shaped pattern. Let's see if price can break this triangle.

The Graph GRT indicating a 10-14x profit opportunity from hereexplosive move preparing to occur. expecting 10-14x from current price. this is as easy as it gets when you have convergence of so many bullish market forces, both technical on BTC and macro-economic from the Fed.
expecting targets to be reached by end of q1 2025. lets wait & see!

GRT New Bullish Impulse StartedGRT has had two significant bullish impulses over the last two years. With price action picking up again over the last two weeks, I'm betting that we're seeing the start of the third GRT impulse.
Note the bottom dotted support line. This has held for the last two years, and is likely to do so for the time being.
I'm looking for a move towards 1$. Stop below the recent swing low.

The Graph Analysis: Bullish for long-termGRT is almost 92% down from its all-time high and is now changing character in HTF, making new higher highs. I expect the price to go parabolic to $0.86 and $4.9 after reaching the main support at $0.15.

GRT/USDT Gaining Momentum for a Bullish Reversal | Get Ready💎#GRTUSDT is navigating an ascending channel and is currently poised to retest the channel's lower support. We anticipate that the support at $0.262 will hold and set the stage for a bullish reversal that could push the price to reach the channel's upper resistance.
💎However, if #GRT fails to maintain the $0.262 support and breaks below, this will signal an extended downward trend. The subsequent critical demand zone at $0.2474 is vital to watch because it is known for its strong liquidity and history of catalyzing significant upward movements.
💎Should JSE:GRT revisit this demand zone, securing a strong rebound is essential to sustain support. Failure to rebound could intensify bearish momentum, worsening market sentiment, and potentially leading to further price declines.
💎Stay alert and ready to adapt, Paradisers. Your ParadiseTeam is vigilantly monitoring and prepared to guide you through the volatile dynamics of the #TheGraph market.
MyCryptoParadise
iFeel the success

GRT The Graph $Grt #Grt The Graph is a great project that not only survived the bear but also has continued to build during the bear as well as create more real-world partnerships and use cases.
Just 2 months ago in the start of March it hit $0.50 (50cents) and has since then suffered from a dramatic 60% correction that IMO was somewhat over done but i was grateful for another shot at buying lower to later sell higher. We have already had a nice bounce over the last couple weeks and i gain trimmed my position for profits/gains.
If BTC continues to see some more downward pressure this week we may also see some more downside again and go back and test the lows.
I'm personally already nibbling at this range and will continue to DCA all the way down and create a new larger bag again and take what the market gives me with intentions of selling in the next MAJOR pump we get and or true alts season if and when it comes.
I would be buying like CRAZY if we get enough drama to give us that lower range in the 13-16 cents areas.
In will be buying in a semi aggressive manner if we come back for a retest of this 20cents range, but I'm not quite sure we get that hence why I began nibbling here. Regardless I'm up on the play fir the cycle and can afford to take some risk with it overall.
In the bigger picture i think it's one of the better plays to get into a situation where you end up holding it longer term and or if you wanted to only buy projects that you can set it and forget it. I think they will continue to do well in this cycle as well as make it through the next bear and be fine in the following cycle.

🔥 GRT Double Bounce: Back To All Time Highs?In this signal I'm going to combine two important reversals:
- The daily RSI on GRT has hit oversold for the first time since September 2023. Daily oversold RSI's are amazing buying opportunities during bull-markets.
- The price retested the bear-market highs of ~0.23 from back in January 2023 as support.
This might be the final bearish move in the next few months, hence the target at the current ATH. Be aware this is a long-term trade and might take months to play out.

The Graph - GRT a simple fact - Bull Flag Forming! Based on this chart, it appears that GRT has developed a bullish flag pattern after breaking out of these bands. The price is currently retesting the upper band while forming a bullish flag and maintaining its overall bullish structure. This setup suggests that it is poised to continue upward and potentially reach its all-time high (ATH)

GRT 2-day chart analysis🐂🐻GRT 2-day chart analysis
Price is above the possible bottom POC at 0.10 and trying to get above the next higher POC at 0.16
bullish scenario🐂
break this resistance and use lack of volume for quick move to FIB 50% at 0.40
bearish scenario🐻
see a fakeout and lose important support at 0.10
How is your day so far dear Crypto Nation?😎
Comments💭, Likes♥️ & Follow🔗appreciated
Disclaimer:
Not financial advice
Do your own research before investing
The content shared is for educational purposes only and is my personal opinion

the Graph dailyhi guys, i how you are enjoying this Sant Friday with all your family.
i post this daily chart because i want to be completed the theory about up flags triangles.
lets wait if after 3 days (i think) triangle brokes resistance and the graph goes upper.

GRT BREAKOUT ALERTGRT is trying to breakout in 4h timeframe, but BTC is going down so, once BTC settles, we might see good momentum.
Targets 0.42, 0.46, 0.50

The Graph breaking up from two different channels Very close to hitting the teal channels breakout target, after that we head for the pink channels breakout target…also likely to go to the beginning of the red bearflag pole around 51 cents as is common with inverse Bart patterns. *not financial advice*
