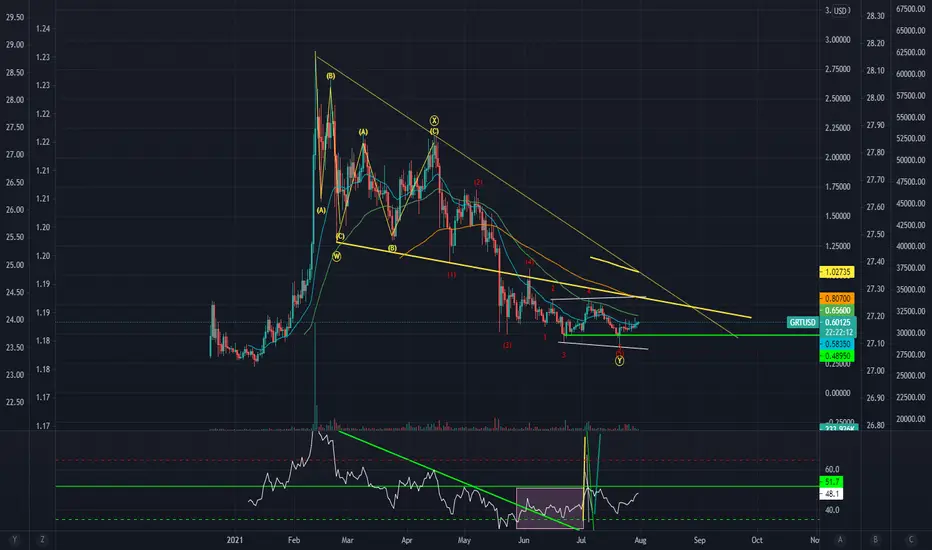
The Graph (GRT) Update 17/10/21: 260% Gain back to the ATH The Graph (GRT) Update 17/10/21: 260% Gain back to the ATH @ $2.88 from the current price level. Since reaching its ATH on 12/02/21 at $2.88, The Graph has experienced moderate retracements in the range between the 38.20% fibs and 78.60% fibs from 12/02/21 to 12/04/21 (from $2.88 to $1.39 50% drop before the May crash). As we saw across the whole market, GRT was heavily affected by the May crash as we saw a lot of fear and panic in the market. More importantly, since hitting its ATH after being shortly launched (18/12/2020), The Graph has not yet even recovered from the retracements between 12th Feb to 12th April, instead The GRT had a further 65% drop from $1.39 (17th May 2021) to $0.48 (20th July 2021). During this downtrend The GRT has retested the bottom at $0.48 3 times forming strong support at the $0.48 price level and a bullish triple bottom chart formation. From the current price we expect the 13EMA to cross up above the 50SMA signalling a Strong Buy Signal for GRT with a potential of 260% gain back to the ATH from the Buy Zone. Please find Our Key Price Targets Below:
Short-term targets
🎯$1.68 111% Gain from the current price
🎯$2.88 260% Gain from the current price
EOY/Q1 2022
🎯$6.76 756% Gain from the current price (261.80% Fibonacci level)
🎯$10.64 1232% Gain from the current price (423.60% Fibonacci level)
$1K investment at the current price would give you a value of $12,320 when The GRT reaches the full fib extension at $10.64. Use Buy Zone to map your entry. Happy Trading :)
Thegraph

TRADING FOR GRT/USDT LONG POST SPOTGRT/USDT
We patiently wait the pullback
Dont FOMO with the explode from GRT
Dont scare missing the moment
#grt #awp95

GRT - known to be the next ChainlinkPrice project of The Graph. My price project for my trade in GRT Futures. Minimal target @ $1.
#TheGraph #GRT #web3.0

1$ Graph soonGraph is moving back to reclaim $1 price and will confirm it as a support. Strong project with Strong fundamentals will be going to give it huge push. This bull run target will be back to $5.

The Graph is about to explode.I don't give any advise, but it looks to me like a breakout to the upside is eminent.

#GRT, Breaking Resistance with Potential Gains?A quick look at #TheGraph (#GRTUSDT, #Binance, D):
Price broke the 0.7592 resistance.
The 4HR timeframe shows a positive retest of that level as support.
Price may test the next resistance at 0.9547.
To read more about The Graph on CoinMarketCap, click here .
What do you think?
Still learning here, so any constructive feedback and positive vibes to improve my analysis are welcome.
Thank you and Happy trading!
------------------------------------------------------
Some of my charts represent actual trades, and some are just paper trading.
Needless to say, this is not financial advice!

GRT/USDT Breakout looking bullishGRT/USDT (The Graph) breaking out of the downtrend since Feb 2021. Currently looking bullish
Use the Greenlines (resistance zone) as targets and enjoy :)
This is not financial advice so please DYOR. Place stop loss below the red lines. Next major support at $0.4393

TheGraph Yes but Waiti was surprised by the weakness of one this big project while BTC was correcting.
No impulse, No rage, No Surprise. Stayed in perpetual weak downtrend for now.
------------------------------------------------------------------------------------------------------------------------------------------
- So i will give a trading simple way :
- Should wait GRT break his Downtrend and pass 1$ to invest in.
- TP1 : 2$
- TP2 : 3.5$
- TP3 : 4.8$
- The new GRT Bottom should be around 0.45$ but have to be prudent in cryptos.
- In Any of this cases if BTC makes a fast Dip (BearTrap), i suggest you to keep some Cash to get GRT around 0.2$.
------------------------------------------------------------------------------------------------------------------------------------------
Stay Safe
Happy Tr4Ding !

GRT Primed for a big run!!?The graph has been under performing recently even though i still remain long term bullish on this great project, we could be ready for a big run coming soon if we can take out a couple key levels. First being the first pivot point we directly are on as of right now, it would be very ideal for GRT to jump above and secure this level for our daily close, next will be the previous pivot point which is above and to the left of our first one, i think we will continue to face resistance here so getting above on the first attempt may not happen, the most ideal level we need to get above before we can really say we are in an uptrend again is the 0.2 FIB level, we haven't been above this level since late May. Looking at the bollinger bands we actually are looking bullish, price action is starting to cling onto the top band which as you guys know can induce a very nice big run to the upside, if i had to guess on where we could land if this plays out, i would say atleast the first level of resistance (R1). Looking at the MACD we are in bull territory but we need to keep pushing upwards to see our blue MA keep separating away from the orange or we risk having a bearish cross, our histogram seems to be really flattening out with our green bars staying the same or getting less, so looking at that i think we might be in for a bearish cross soon but there is a chance we could get a bounce aswell, definitely need to see some momentum and volume for GRT if we are going to keep pushing up. Not financial advice just my opinion!

Grt - Quick profitGrt is ready to explode. Look for the resistance to break and a long can be opened here.

The Google of CryptoWanna be rich? Me too.
Not sure if this will do it, but it's better than the other chances I got.
All time low.
Great crypto. Amazing concept with over 3 years of Beta testing before launching just last December.
Downside risk is -50% but the upside reward will be at least +500%.
Let's GOOO!!!
(Not Financial Advice....but yah know...)
1$ GRT is coming Grt is looking super bullish. Lets wait for it to break the resistance line to open a long here

GRT is turning aroundBeen watching GRT for months now and finally seeing the turnaround start. There is a clear bullish divergence in both the RSI and the MACD. As the price has continued to decline while the RSI and MACD signal lines have been climbing. Finally seeing an RSI breakout (for the moment) and I jumped in with a starter position here.

🆓The Graph (GRT) July-8 #GRT $GRTGRT has conquered the $0.7 zone and it is heading towards the $1 zone, however selling at this zone has appeared so there is still a risk that it can correct to the $0.6 zone before rising to $1.
📈BUY
🔴Buy : 0.68-0.72$. SL if B
📉SELL
🔴Sell : 0.975-1.025$. SL if A
♻️BACK-UP
🔵Sell : 0.68-0.72$ if B. SL if A
🔵Buy : 0.585-0.615$ if A. SL if B
❓Details
🕯Timeframe : 1 Day
📈Red Arrow : Main Direction as BUY and SELL section
📉Blue Arrow : Back-Up Direction as BACK-UP section
🟩Green zone : Support zone as BUY section
🟥Red zone : Resistance zone as SELL section
🅰️A : The Close price of candlestick is Above the zone
🅱️B : The Close price of candlestick is Below the zone

The Graph Protocol analysis. $GRTThe Graph Protocol has had a pretty significant retrace from the highs early this year. One thing that is concerning about GRT is the tokenomics are very poor. Over the span of 2021 around 5 billion coins will be released into the circulating supply. This will most definitely have a impact on price of the coin.
COINBASE:GRTUSD A couple levels to watch for, you would really only want to buy GRT above 80 cents with strength or buy at the 2021 lows.
Right now price is sitting in no mans lands and it would be risky to buy at this level.
Keep eye on the graph tokenVery good trade idea if Grt breaks this resistance line it can easy pump to about 90cent I’m currently accumulating grt between 40 to 50 cents fundamentals of this token is also good if Bitcoin dominance goes down grt and other low cap coin gonna pump hard so good luck keep trading I will update you about how my trade goes in comments

The Graph - The Bulls Are Ready To Play Analysis:
- Reverse Fibonacci Retracement
- Support & Resistance
-Trendline Analysis
- Order Block Flow Analysis
Inflection: $1.1357
Bull Cycle Begins: $1.5657
Buy Scale Ins: $1.8856 / $2.1122 / $2.3388
Opinion:
The Graph is gearing up for a beautiful BULL run
The Graph is another long term hold coin for me
Some call it the "Google" of crypto
I am buying coins myself at these super cheap prices and I will probably scale more buys as we move up
Let the games begin :)

GRT - Cliffwalking ShortI don't know what this is and I don't think it really matters The Graph - ok. This is a very weak chart, similar to ETH but much worse. Price is hovering under 1hr 50ma which in a downtrend it probably won't cross, and almost all support has passed and is now resistance. VPVR shows there is very little support, so this could walk straight of a cliff shortly and in consideration of BTC BTC.D that might be quite soon.


GRT / BTC - The Graph's Potential Path from HerePure conjecture, based on price action of and experience watching other similar new assets that have shown like promise.

GRTUSDT going long After BTC's bloodbath, the Graph GRT is at Jan 2021 lows in both pairs BTC and USDT. It almost lost all this year's gains.
I am going long from here due to the fact it is a low risk, and I am not planning to scalp but HODL. If you want to properly trade it, just buy at the breakout from the forming falling wedge on either chart; BTC or USDT.
PS in such volatile market, one should make sure to trade Alts that are fundamentally solid. Speculative trades would be high risk unless one's scalping.

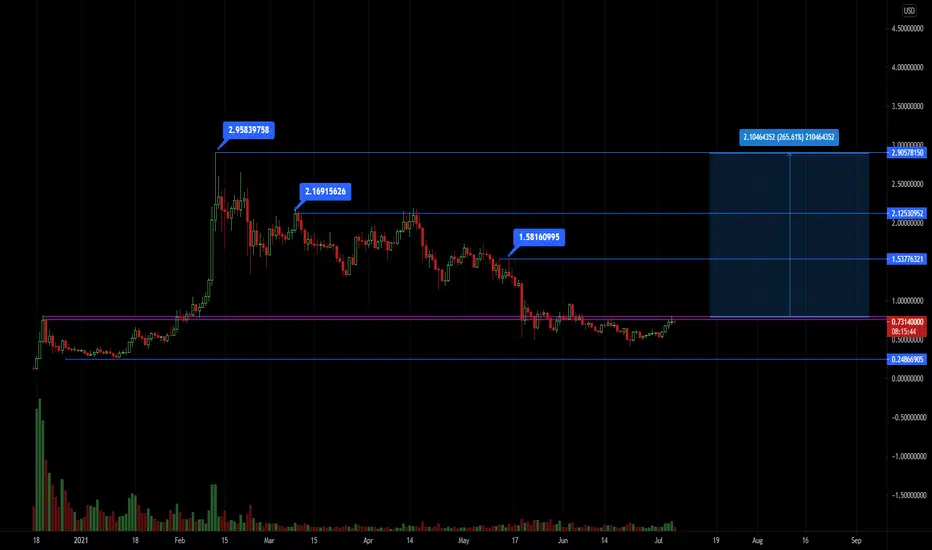
GRTUSD correction finished....moving into wave 3After a meteoric rise, and devastating correction - it appears that GRT is bottoming and in the infancy of reversal.
Requires some strength in Bitcoin to continue this bounce, otherwise back to retest the lows and form a rounded bottom.
highlighted horizontal lines indicate potential areas of support/resistance

TheGraphWhen peoples see Despairs and fears, i see opportunities. Double Bottomed here. Patience is your weapon.
Trading Parts :
- Buy Zone Now
- Rebuy Zone 1$ ( Strong Buy )
TP1 : 1.49$ (Security TP)
TP2 : 1.96$
Stay safe, follow BTC and don't be greedy !
Happy Tr4Ding !
