USDJPYLONG USDJPY
Price is above EMAs and MACD is also approaching and seems to be crossing above 0.
Price is also holding above a short term ascending trendline support.
I will enter on pullbacks and targets are based on key Fibo retracements. Very nice R/R as well!
Please DYODA (Do Your Own Due Analysis)
Thelaughingchartist
EURUSD [2 Trade Ideas]Short EURUSD
Entry: 1.11675
TP: 1.1114
SL: 1.1183
Long EURUSD
Entry: 1.11235
TP: 1.11820
SL: 1.11040
First time trying this. 2 trade ideas in one chart.
OVERALL BULLISH BIAS
Market testing resistance and also in a strong supply/demand zone (grey box). A short term drop is expected.
Market expected to drop and test ascending trendline support where we can enter a long position at 1.11235 where I expect to see a bounce above.
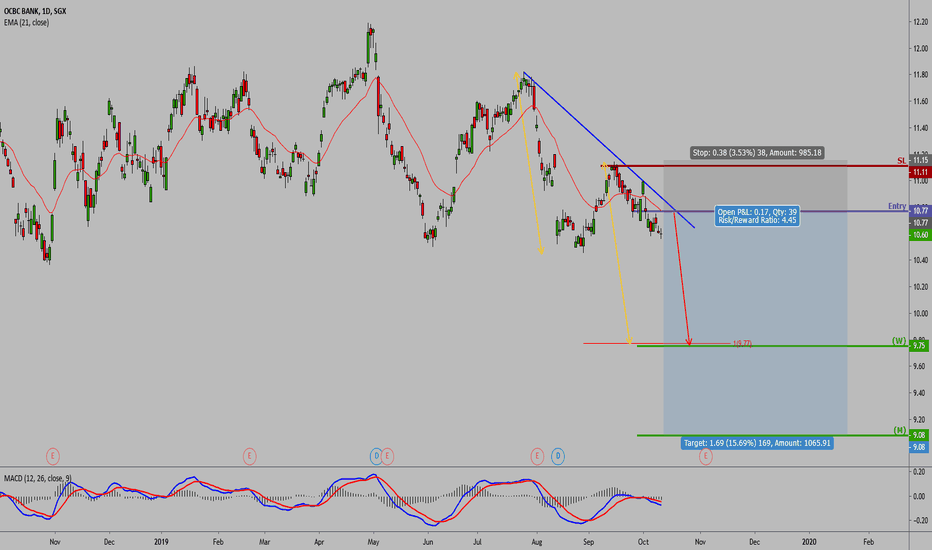
OCBC [1-3 weeks view]SHORT OCBC
Entry: 10.77
TP1: 9.75
TP2: 9.08
SL: 11.15
Market holding below natural moving average and descending trendline resistance.
MACD in bearish territory
Trade safe guys! Feel free to reach out to me if anything!
Cheers
**Trading is a high risk activity. Follow my personal calls at your own discretion. Always do your own due diligence and analysis. I do not take any responsibility for your losses**
Venture Corp [1-3 weeks view]SHORT Venture Corp
Entry: 15.42
TP1: 14.85
TP2: 12.93
SL: 16.10
Market reacting below descending trendline resistance.
Trade safe guys!
**Trading is a high risk activity. Follow my personal calls at your own discretion. Always do your own due diligence and analysis. I do not take any responsibility for your losses**
Market Correction Approaching? [S&P Q4 2019]ARE WE ABOUT TO SEE A MARKET CORRECTION?
As we finish off Q3 2019 and approach Q4 2019, we see that S&P is holding strongly about its new all time high. However, exactly a year ago, as September 2018 wrapped up, it started the great correction of 2018. Whereby the market erased all of the gains it made for the whole year. Some would argue that the crash started in Dec 2018 with none other than President Trump himself officiating the opening ceremony with his famous tweet "I am a tariff man". However on hindsight, I personally believe that the 2018's great correction started at the end of September for the following reasons:
1. The October Effect - Whether you believe it or not, this psychological effect has many times spooked market investors over and over again.
2. Portfolio Re-balancing - Institutions would normally re-balance their books and portfolios
3. Global negative events - Trade War, yield curve inversion and economic slowdown
Fast forward to today, as we approach the last week of September 2019, our investment climate mirrors exactly the climate 1 year ago.
Technically speaking:
1. Market is testing it's all time high.
2. All time high also occurs near a Fibonacci Extension level of 76.4%
3. MACD indicator is starting to reverse from it's resistance where market reversed in the past. Moreover, we are starting to see divergence forming
4. The great correction of 2018 tested and reacted right above it's 200 period EMA. Now, the same 200 period EMA is also approaching a key Fibonacci Retracement level of 61.8% at around the 2590 region.
I explain in greater detail on my blog. Feel free to reach out to me!
thelaughingchartist.wordpress.com
Cheers.
Gold [1-3 days view]Short Gold
Entry: 1291.50
SL: 1303.40
TP: 1247.75
Global markets are currently in a risk off environment given the recent trade-war escalation tweets by Trump. This also is in line with safe-haven currency such as JPY outperforming this week.
Technically, market reacted below long term descending trednline resistance.
Price is also currently testing what I would call the natural MA of the market.
MACD shows a bearish crossover, however, do note that it is still within bullish territory.
Update: Trade was triggered overnight, and market has moved quite a bit as expected. I've trailed my stop loss to protect the trade and some profits. This trade is now risk free.
AEM Holdings (SGX)Market drop in progress towards Trend level at $1.00/$0.97 region. After which an intermediate bounce is expected.
Market reacted below desceding trendline resistance
RSI (21) reacted below 53% resistance level and has entered bearish territory below 50% level.
RSI (21) 53% resistance level is also where price has reacted many times in the past, as seen by the yellow arrows.
Buying area finds confluence with fibo retracement and strong supply and demand level.
Just an educational post to show how a confluence of technical elements can give a good trade with much higher probability. Also, because there is no good risk reward to this, I'm posting this as an educational material.
Gold [1-3 days view]Short Gold
Entry: 1283
SL: 1287.77
TP1: 1273.75
TP2: 1260.75
I expect a Gold to drop.
Market close to descending trendline resistance.
RSI also testing descending trendline resistance. Market has reacted below this resistance multiple times in the past (shown by yellow arrows).
Long term, market within a descending wedge pattern.
Market however is still holding above it's short term natural EMA. Once this EMA is broken, we should see a higher conviction of a deeper drop.


