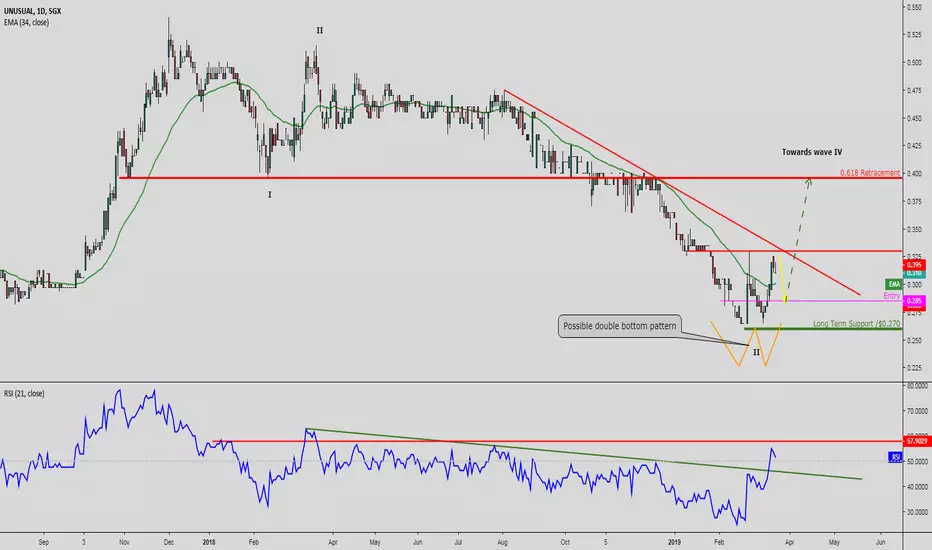
Unusual (1D1 - SGX) [1-3 weeks view]Long 1D1 with low conviction
Entry: $0.285
SL: $0.270
Market is forming a possible double bottom reversal pattern.
Only when price surpasses $0.330 will this reversal pattern be confirmed.
$0.330 is also a strong resistance level found twice via:
- Descending trendline resistance
- Double bottom neckline
Should market break above $0.330, we can expect to see price rise towards $0.395 which is both 0.618 retracement level and a probable wave 4 target.
Thelaughingchartist
GBPJPY [1-3 days view]SHORT GBPJPY
Entry: 145.725
SL: 146.500
TP1: 143.800
TP2: 142.200
Market reacted below descending trendline resistance.
Similarly, MACD indicator showed a bearish cross signalling for market to go lower.
This trade was entered yesterday but I forgot to publish it. However, as expected, market has moved in my direction. I have also moved my trailing stop lower to protect this trade.
Trade is now risk free.

AUDJPY [ 1-3 days view]SHORT AUDJPY
ENTRY: 78.695
SL: 79.045
TP: 77.500
Market reacting below descending trendline resistance.
Market also holding below it's natural MA (34). We see that price respected MA (34) quite often in the past.
Stochastics also shows a reversal with room for further downside potential.

Gold [1-3 days view]Short Gold
Entry: 1299.05
SL: 1313.15
TP1: 1266.25
TP2: 1254.75
Market reacted above descending wage support with price closing above EMA (21).
MACD still in bearish territory however, showing a golden cross signalling a possible reversal.
Wait for a pullback to short below 1299.05 where also happens to be descending range resistance.

GBPJPY [1-3 days view]Short GBPJPY
Entry: 146.015
SL: 146.900
TP: 144.200
Market broke below ascending trendline support (now resistance)
H&S pattern seen forming
Market holding below EMA and MACD now in bearish environment

USDJPY [1-3 days view]Long USDJPY
Entry: 110.655
SL: 110.33
TP: 111.42
After the crazy impulsive move down, market actually rebounded. Price is now testing ascending trendline support.
Market is also holding above EMA (17). MACD is now testing 0% level and has moved up into bullish territory.
This is a short term play with a simple risk reward of 1:2
Market pulled back and triggered my buy order.

USDJPY [1-3 days view]Long USDJPY
Entry: 111.285
SL: 111
TP: 112.5
Long position was kicked in as market pulled back towards ascending channel support. This also corresponds with a strong supply/demand level.
Market also testing EMA (120) where price reacted above before. This can also be seen on RSI (34). I have pointed it out using the purple arrows. RSI (34) also coming to test ascending trendline support.

GBPJPY [1-3 days view]Short GBPJPY:
ntry: 147.105
SL: 147.85
TP1: 144.850
TP2: 143.5
After a strong rally upwards, we see a divergence between momentum and price. RSI (21) has also crossed into the bearish territory below the 50% level.
Shortly after which, market broke below the ascending trendline support (now resistance).
Price has also closed below EMA (34) which has acted as a pretty solid support/resistance for GBPJPY

EURUSD [1-3 days view]This trade was triggered earlier this week. However, I chose not to publish it as it was a low probability trade for me at that time for the following reasons:
Market was only testing the ascending trendline support (now resistance)
Normally I would wait for a pullback to retest the trendline before entering to short
Market was also forming a Head & Shoulders reversal pattern however at trade time, it was still not confirmed.
I choose to publish this trade now because I believe it presents a very strong case of how a trade can really move in your direction when multiple technical elements show confluence to provide that confirmation despite the low conviction I had.
1. Market was forming a Head & Shoulders reversal pattern
2. Market broke below the ascending trendline support (now resistance).
3. At the same time, market also had one candle close just below the EMA (13). This EMA as noted in the past provided quite a good support/resistance where price reacted above and below it.
4. MACD momentum indicator at trade execution crossed below 0% and entered bearish territory. The MACD and signal line also showed strong downwards momentum.
5. Everytime price broke below an ascending trendline support (turned resistance), market will make a strong and sustained downwards push. This happened at the 2nd week of Jan 2019 and once more at the start of Feb 2019. Now at the start of March 2019, we see this pattern repeated again.
This is a quite a beautiful example of how technical analysis can be a very powerful skill to have for any market participant. Reach out to me to find out more!

AUDUSD [1-3 days view]Entry: 0.71465
SL: 0.7185
TP: 0.705
This trade was knocked in this wed (27th Feb 2019). The reasons why I went short is listed below:
Whilst market reacted above the ascending trendine support (in red), it failed to surpass resistance at 0.72100
Market then broke below ascending trendline support and also spiked below 55 period EMA
At the same time, MACD showed a 'death cross' and also broke below '0' meaning it has entered bearish territory.
This week has not been an easy week! But still keeping my eyes peeled open for more opportunities!

EURUSD [1-3 days view]This was quite a simple set up though admittedly, the risk reward wasn't great. However, when presented with an opportunity, I will grab it.
Here i saw market reacting above ascending trendline and also holding above EMA34. MACD was also in a bullish environment. Market was also testing a very key long term trend level at 1.135.
I set my entry at 1.13525 and waited for the 2nd pullback and retest of the trendline. Pullback happened exactly as expected and knocked my position in.
1.14 price target is actually based on fibo retracement at the 61.8% of the previous downswing.
Market hit target exactly and closed this position with a profit of 47 pips. With this much confluences, wouldn't you take the trade too?

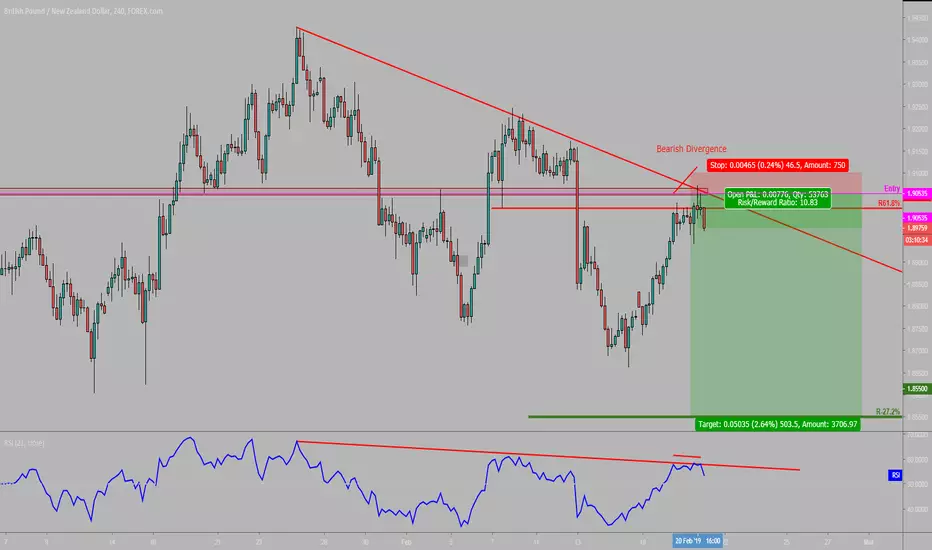
GBPNZD [1-3 days view]Short GBPNZD
Entry: 1.90535
SL: 1.91
TP: 1.855
Entry was triggered overnight due to the spike, which also coincided with the pullback towards the descending trendline resistance.
Now market reacting below the descending trendline.
Bearish divergence noted on 21 period RSI
RSI also reacting below descending trendline resistance where market reacted in the past.
Because of the quick move in my favour, i moved my trailing stop lower to protect profits and this trade is now risk free.
EURAUD [1-3 days view]Short EURAUD
Entry: 1.558845
SL: 1.593
TP: 1.578
Market initially spiked up and triggered my entry position before making a pullback below descending trendline resistance.
Market also holding below 55 period EMA
MACD below 0 level showing that we are still in a bearish configuration. This is a short term trade.
This is a follow up from my previous trade...

EURAUD [1-3 days view]Short EURAUD
Entry: 1.558845
SL: 1.593
TP: 1.578
Market initially spiked up and triggered my entry position before making a pullback below descending trendline resistance.
Market also holding below 55 period EMA
MACD below 0 level showing that we are still in a bearish configuration. This is a short term trade.
This is a follow up from my previous trade... I waited for the pullback to re-enter the short....

EURAUD [1 Week view]Short EURAUD
Entry: 1.59405
SL: 1.59805
TP: 1.58500
Simple set up, as clear as day.
Market below EMA 13
H&S reversal pattern confirmed with the breaking of the neckline
RSI below 55% resistance level
Market pullback below descending trendline resistance

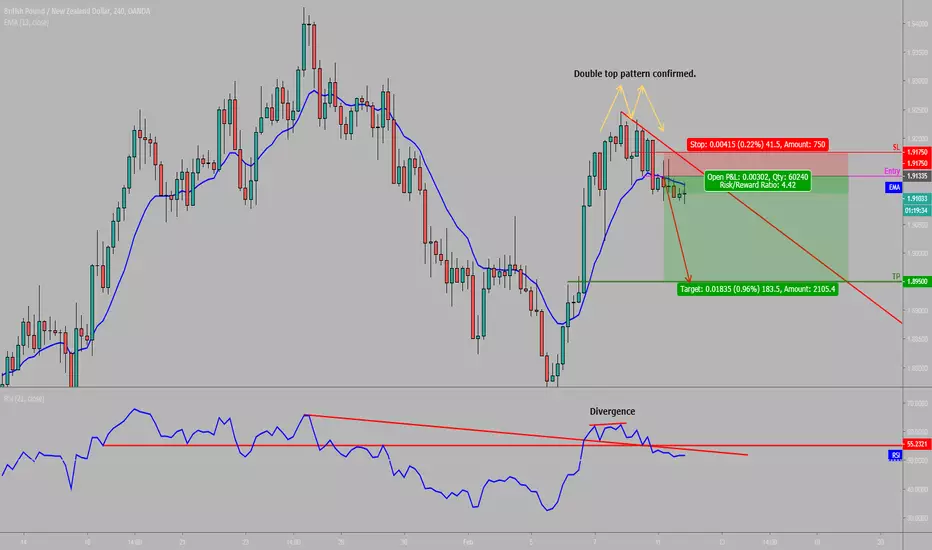
GBPNZD [1 week view]Short GBPNZD
Entry: 1.91335
SL: 1.91750
TP: 1.8950
Simple and clean set up.
Market below EMA
Double top reversal pattern confirmed
Market reacting below descending trendline resistance
RSI below resistance and showing bearish divergence
EURCAD [1-4 days view] +++Long EURCAD with high conviction (+++)
Entry: 1.51675
SL: 1.51325
TP: 1.52800
We continue to see upwards momentum given the EMAs.
Also, market has formed a flag pattern with a breakout to the upside.
Similarly, market has surpassed descending trendline resistance (now support) to the upside.
Based on price action, market failed to make LH and LL. This shows a reversal in the directional price movement.
As such, I am waiting for a pullback towards my entry before an explosive move upside.
Will continue to monitor this.
Note: I already have a prior LONG position on this pair. This trade is just to add on to my position.

NZDCAD [1-3 days view] ---SHORT NZDCAD with high conviction (---)
Entry: 0.90655
SL: 0.90580
TP: 0.88500
Great risk reward trade.
Bearish divergence posted on MACD.
MACD is peaking where market reversed before.
Previous trade did not trigger entry. Due to a change in market structure. As such, this is an update.

NZDCAD [1-3 weeks view] ---Short with high conviction (---)
Entry: 0.9100
SL: 0.9150
TP: 0.8702
Market close to descending trendline resistance.
I will start to keep my charts clean and simple.

GBPJPY [1-3 weeks view] --Short with Good conviction (--)
Entry: 141.50
SL: 142.20
TP: 134.50
Market is now within a long term bearish dynamic.

GBPUSD [1-3 days view] - - -SHORT with high conviction (- - -)
Entry: At market
SL: 1.2915
TP: 1.265
Indicators shows room for further downside along with a good risk reward! Follow the arrow. Have a great week everyone.
