USDCHF on the 1H time-frameUSDCHF on the 1H time-frame.
Steps:
1. The price created double top and breakout the previous low to confirmed the reversal pattern.
2. OPEN SELL #1 when the price breakout the previous low or neckline.
3. OPEN SELL #2 when the price breakout the next low level.
4. The target price are TP1:0.91489, TP2:0.90753, TP3:0.90017 and TP4:0.89563 at the Fibonacci level.
Themasterfx

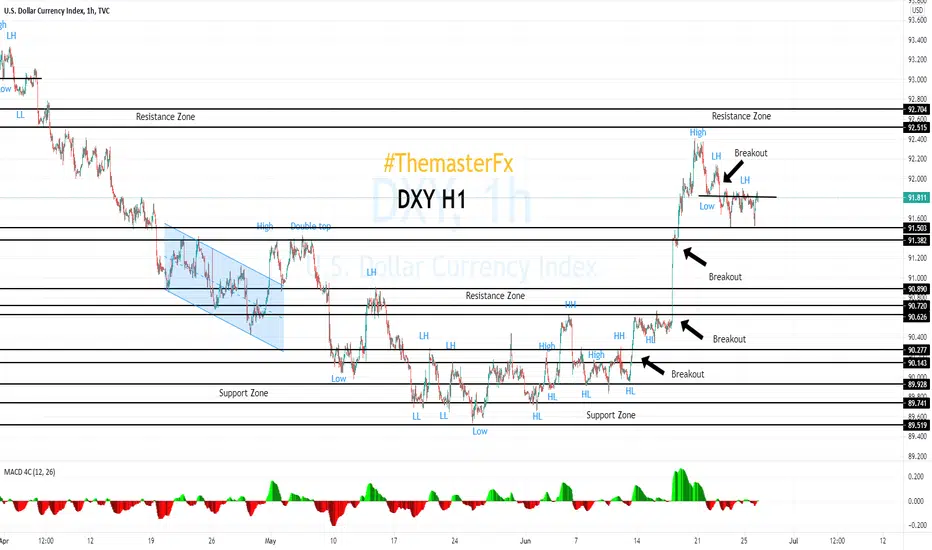
DXY on the 1H time-frameDXY on the 1H time-frame.
Steps:
1. Dollar index created double top which is a reversal pattern at the resistance zone.
2. The 1st scenario, it can not breakout the support zone and pullback to the resistance zone again in between 92.515 to 92.704
3. The 2nd scenario, it can breakout the support zone and go down to the next level of support zone at 91.503 to 91.382

NZDUSD on the 1H time-frameNZDUSD on the 1H time-frame.
Steps:
1. The trend is not clear at this time.
2. Keep waiting to find out the reversal pattern.

AUDUSD on the 1H time-frameAUDUSD on the 1H time-frame.
Steps:
1. The price is running downtrend and if it create the lower high at this MACD (+) that mean downtrend still active.
2. If the price create the higher low at the next MACD (-) and breakout the previous high which will be confirmed the reversal pattern.

USDCAD on the 1H time-frameUSDCAD on the 1H time-frame.
Steps:
1. OPEN SELL ORDER position at the breakout previous low.
2. If the price create the lower high at the next MACD (+) that mean downtrend still in active.
3. Stop loss at high price level.

USDJPY on the 1H time-frameUSDJPY on the 1H time-frame.
Steps:
1. The price still running in the parallel channel of uptrend.
2. Will open SELL ORDER at the upper channel and TP at the lower channel.
3. Will open BUY ORDER at the lower channel and TP at the upper channel.
4. Stop loss when breakout the channel.

EURUSD on the 1H time-frameEURUSD on the Day time-frame.
Steps:
1. The price still running downtrend and already hit TP at the Fibonacci level 361.8%
2. If the price create the lower high at this MACD (+) and breakout the previous low that mean downtrend still active.
3. The next TP is at the Fibonacci level 423.6%
4. Trailing stop still working.

GBPUSD on the 1H time-frameGBPUSD on the 1H time-frame.
Steps:
1. The price is running downtrend and if the price create the lower high at this MACD (+) that mean the downtrend still active .
2. If the next MACD (-) create the higher low and breakout the previous high which will be confirmed the reversal pattern.
3. Keep waiting for take an action.

USDCHF on the 1H time-frameUSDCHF on the 1H time-frame.
Steps:
1. The price is running an uptrend.
2. If the price create the higher low and breakout the previous high that mean an uptrend still active.
3. If the price create the lower high and breakout the previous low which will be confirmed the reversal pattern.
4. Keep waiting for take an action.

GOLD on the 1H time-frameGOLD on the 1H time-frame.
Steps:
1. Still holding SELL ORDER position #1 #2 #3 because the price can not breakout the previous high.
2. When the price breakout the previous high at the strong resistance zone and create the higher low which will be confirmed the reversal pattern of uptrend.
3. If the price create the lower high and breakout the previous low to confirm downtrend still active.
4. Keep waiting for take an action.

DXY on the 1H time-frameDXY on the 1H time-frame.
Steps:
1. Dollar index hit the resistance zone.
2. When it create the lower high and breakout the previous low which will be confirmed the reversal.
3. When it create the higher low and breakout the resistance zone which is still going uptrend.

XAUUSD on the 1H time-frameGOLD on the 1H time-frame.
Steps:
1. OPENED SELL ORDER #1 #2 and #3 from the reversal pattern were looking good.
2. The price reached all the TP at the Fibonacci level 423.6% and here is the strong support zone.
3. Still running downtrend and will open SELL ORDER #4 when the price breakout 1755.614
4. The next target price will be 1719 and 1678 accordingly.

NZDUSD on the 1H time-frameNZDUSD on the 1H time-frame.
Steps:
1. The price created the higher low and breakout the previous high to confirmed the reversal pattern.
2. OPEN BUY ORDER at the breakout previous high and running uptrend.
3. TP1: 0.70552 and TP2: 0.71122
4. Trailing stop is working.

AUDUSD on the 1H time-frameAUDUSD on the 1H time-frame.
Steps:
1. The price created the higher low and breakout the previous high to confirmed the reversal pattern.
2. OPEN BUY ORDER at the breakout previous high and running uptrend.
3. TP1: 0.76290 and TP2: 0.75803
4. Trailing stop is working.

USDCAD on the 1H time-frameUSDCAD on the 1H time-frame.
Steps:
1. The price created the lower high and breakout the previous low to confirmed the reversal pattern.
2. Will OPEN SELL ORDER at the breakout previous low.
3. TP1: 1.21481 and TP2: 1.20281
4. Stop loss at high price level.

USDJPY on the 1H time-frameUSDJPY on the 1H time-frame.
Steps:
1. The price created the lower high and breakout the previous low to confirmed the reversal pattern.
2. OPEN SELL ORDER at the breakout previous low.
3. TP1: 110.241 and TP2: 109.785
4. Stop loss at high price level.

EURUSD on the 1H time-frameEURUSD on the Day time-frame.
Steps:
1. The price created the higher low and breakout the previous high to confirmed the reversal pattern.
2. OPEN BUY ORDER at the breakout and running uptrend.
3. Stop loss at low price level.

GBPUSD on the 1H time-frameGBPUSD on the 1H time-frame.
Steps:
1. The price created the lower high and breakout the previous low to confirmed the reversal pattern.
2. OPENED SELL ORDER when breakout the previous low at strong support zone.
3. The price hit the target price at Fibonacci level 381.8% and also at the strong support zone.
4. It is now creating the lower high at the MACD (+) and that mean still running downtrend.
5. Trailing stop is working at this lower high.

USDCHF on the 1H time-frameUSDCHF on the 1H time-frame.
Steps:
1. The price created the lower high and breakout the previous low to confirmed the reversal pattern.
2. OPEN SELL ORDER at the breakout previous low.
3. TP1: 0.90949 and TP2: 0.90219 at the Fibonacci level.
4. Stop loss at 0.92375

DXY on the 1H time-frameDXY on the 1H time-frame.
Steps:
1. Dollar index created the lower high and breakout the previous low to confirmed the reversal pattern.
2. DXY is moving in the sideway.
3. Waiting for breakout and see the next step forward.
NZDUSD on the 1H time-frameNZDUSD on the 1H time-frame.
Steps:
1. The price created the lower high and breakout the previous low to confirmed the reversal pattern.
2. OPENED SELL ORDER #1 when the price breakout the previous low at 0.72419
3. OPENED SELL ORDER #2 when the price breakout the previous low at 0.71670
4. The target reached all the TP at the Fibonacci level and it is running to 685.4% at 0.68980
5. The next support line is 0.67900 in H4 time-frame.

AUDUSD on the 1H time-frameAUDUSD on the 1H time-frame.
Steps:
1. OPENED SELL ORDER #1 at the strong resistance zone.
2. OPENED SELL ORDER #2 at the breakout previous low.
3. Target price at the lower channel.
4. Target price at the Fibonacci level and it is running to 685.4% at 0.74561
5. The next support line is 0.73384 in H4 time-frame.

USDCAD on the 1H time-frameUSDCAD on the 1H time-frame.
Steps:
1. The price created the higher low and breakout the previous high to confirmed the reversal pattern.
2. The price reached all the TP at the Fibonacci level until now 685.4%
3. The price still running strong uptrend and more power buy volume.
4. The next resistance line is 1.26314
