GBPJPY on the M30 time-frameGBP/JPY may rise 101 - 146 pips
Our pivot point stands at 160.63.
Our preference
The upside prevails as long as 160.63 is support.
Alternative scenario
Below 160.63, expect 159.86 and 159.41.
Comment
The RSI is above 50. The MACD is positive and above its signal line. The configuration is positive. Moreover, the price is trading above both its 20 and 50 period moving average (respectively at 160.92 and 160.92).
Themasterfx

FTSE 100 on the 1D time-frameFTSE 100 may rise to 7618.00 - 7690.00
Pivot 7318.00
Our preference
Long positions above 7318.00 with targets at 7618.00 & 7690.00 in extension.
Alternative scenario
Below 7318.00 look for further downside with 7190.00 & 7065.00 as targets.
Comment
The RSI is mixed and calls for caution.
Supports and resistances
7814.00 **
7690.00 **
7618.00 **
7543.30 Last
7318.00 ***
7190.00 **
7065.00 **
Number of asterisks represents the strength of support and resistance levels.

BTCUSD on the M30 time-frameBitcoin / Dollar may fall 1612 - 2402 pips
45760 is a pivot point.
Our preference
The downside prevails as long as 45760 is resistance.
Alternative scenario
Above 45760, look for 47090 and 47880.
Comment
The RSI is trading below 30. This could mean that either the price is in a lasting downtrend or just oversold and that therefore a rebound could shape (look for bullish divergence in this case). The MACD is negative and below its signal line. The configuration is negative. Moreover, the price is trading under both its 20 and 50 period moving average (respectively at 45301 and 46215).
Supports and resistances
47880 **
47090 *
45760 **
45240
44702 last
43090
42300 **
41510 *
40720 **
Number of asterisks represents the strength of support and resistance levels.

AUDCHF on the M30 time-frameAUD/CHF may rise 35 - 49 pips
Pivot point stands at 0.6889.
Our preference
Rebound towards 0.6969.
Alternative scenario
Below 0.6889, expect 0.6866 and 0.6852.
Comment
The RSI is below 50. The MACD is above its signal line and negative. The configuration is mixed. Moreover, the price stands below its 20 and 50 period moving average (respectively at 0.6922 and 0.6936).
Supports and resistances
0.6996 **
0.6982 *
0.6969 **
0.6955
0.6920 last
0.6898
0.6889 **
0.6866 *
0.6852 **
Number of asterisks represents the strength of support and resistance levels.

CADCHF on the M30 time-frameCAD/CHF may rise 28 - 41 pips
Pivot point is at 0.7365.
Our preference
Rebound.
Alternative scenario
Below 0.7365, expect 0.7342 and 0.7329.
Comment
The RSI is above its neutrality area at 50. The MACD is above its signal line and negative. The MACD must break above its zero level to trigger further gains. Moreover, the price is trading above its 20 period moving average (0.7387) but under its 50 period moving average (0.7399).
Supports and resistances
0.7461 **
0.7447 *
0.7433 **
0.7420
0.7392 last
0.7374
0.7365 **
0.7342 *
0.7329 **
Number of asterisks represents the strength of support and resistance levels.

Dow Jones on the M30 time-frameDow Jones may rise to 35540 - 35820
Pivot
34950
Our preference
Long positions above 34950 with targets at 35540 & 35820 in extension.
Alternative scenario
Below 34950 look for further downside with 34550 & 34340 as targets.
Comment
The RSI is around its neutrality area at 50%
Supports and resistances
36000
35820
35540
35295 Last
34950
34550
34340
Number of asterisks represents the strength of support and resistance levels.

S&P 500 on the M30 time-frameS&P 500 may rise to 4700.00 - 4744.00
Pivot
4575.00
Our preference
Long positions above 4575.00 with targets at 4700.00 & 4744.00 in extension.
Alternative scenario
Below 4575.00 look for further downside with 4514.00 & 4485.00 as targets.
Comment
The next resistances are at 4700.00 and then at 4744.00.
Supports and resistances
4800.00
4744.00
4700.00
4630.00 Last
4575.00
4514.00
4485.00
Number of asterisks represents the strength of support and resistance levels.

GBPUSD on the M30 time-frameGBP/USD may rise 18 - 38 pips
Pivot
1.3120
Our preference
Long positions above 1.3120 with targets at 1.3185 & 1.3205 in extension.
Alternative scenario
Below 1.3120 look for further downside with 1.3105 & 1.3080 as targets.
Comment
The RSI shows upside momentum.
Supports and resistances
1.3225
1.3205
1.3185
1.3167 Last
1.3120
1.3105
1.3080
Number of asterisks represents the strength of support and resistance levels

USOIL on the M30 time-frameCrude Oil (WTI) may rise to 111.00 - 114.10
Pivot
104.60
Our preference
Long positions above 104.60 with targets at 111.00 & 114.10 in extension.
Alternative scenario
Below 104.60 look for further downside with 103.50 & 102.10 as targets.
Comment
The RSI is above its neutrality area at 50%.
Supports and resistances
116.60
114.10
111.00
108.20 Last
104.60
103.50
102.10
Number of asterisks represents the strength of support and resistance levels.
XAUUSD on the M30 time-frameGOLD on the M30 time-frame
Pivot
1913.00
Our preference
Long positions above 1913.00 with targets at 1936.00 & 1945.00 in extension.
Alternative scenario
Below 1913.00 look for further downside with 1904.00 & 1895.00 as targets.
Comment
The RSI advocates for further advance.
Supports and resistances
1958.00
1945.00
1936.00
1923.50 Last
1913.00
1904.00
1895.00
Number of asterisks represents the strength of support and resistance levels.

XAGUSD on the 1H time-frameSILVER on the 1H time-frame
The price is confirmed a reversal pattern and running downtrend. The target price is at the Fibonacci level.

XAUUSD on the 1H time-frameXAUUSD on the 1H time-frame
The price is running downtrend as the trading plan and TP at the Fibonacci level.

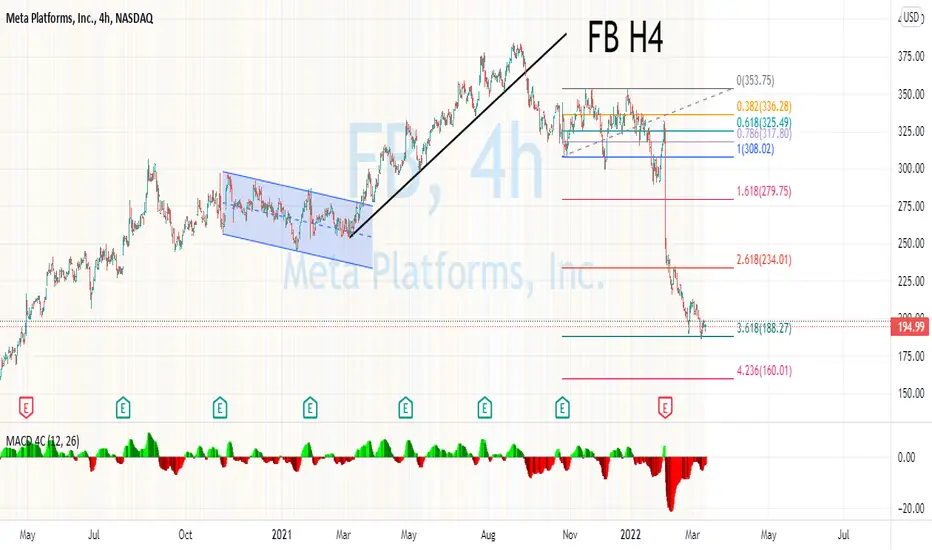
FB on the 1H time-frameMeta Platforms on the 1H time-frame
The price still running downtrend and meet the Fibonacci level.
BABA on the 1H time-frameBABA on the 1H time-frame
The price is creating downtrend continuously until now and you can follow the trend.

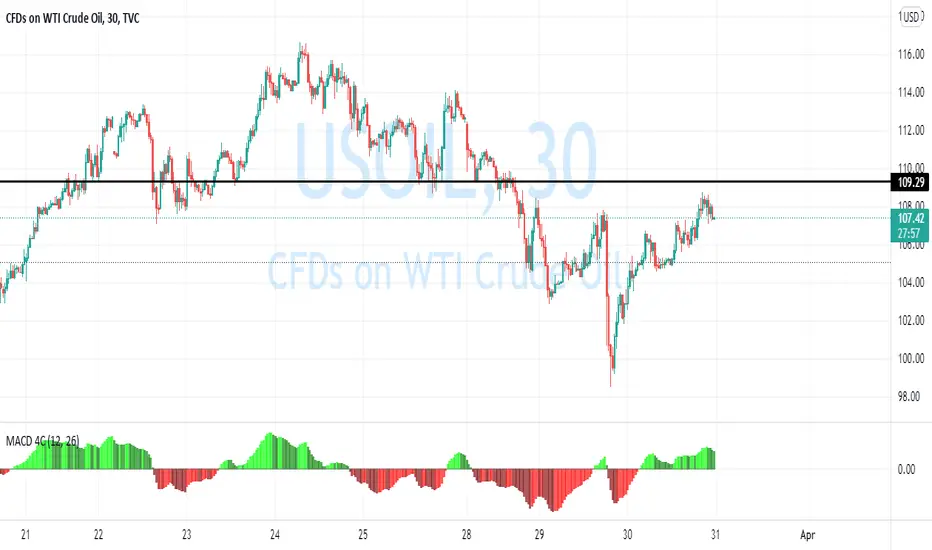
Crude Oil WTI on the 1H time-frameUSOIL on the 1H time-frame
The price hit Fibonacci Extension and now still creating the higher low and higher high for an uptrend.

SILVER on the 1H time-frameXAGUSD on the 1H time-frame
The price is running uptrend same as Gold by creating higher high and higher low.

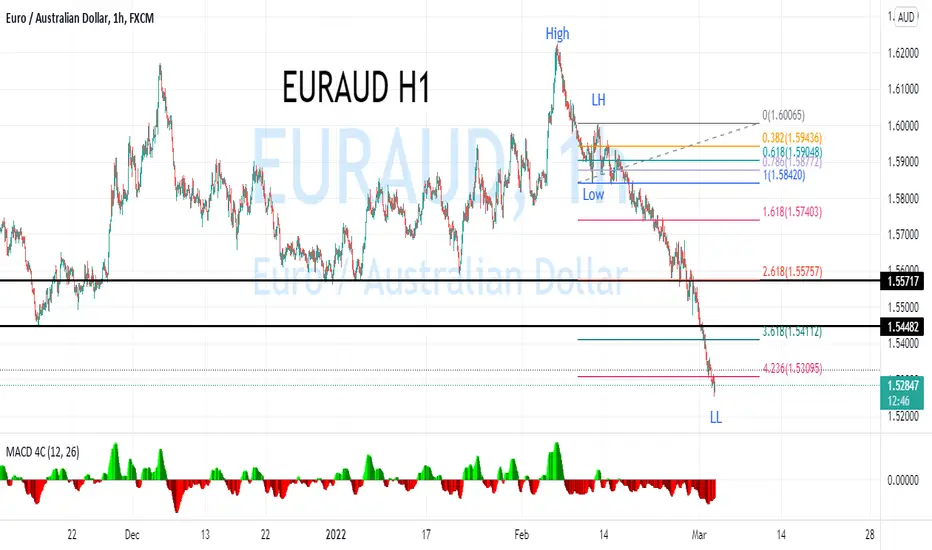
EURAUD on the 1H time-frameEURAUD on the 1H time-frame
The price still running downtrend by creating lower high and breakout the previous low and you can see the MACD is shown under the zero line that mean the Selling momentum still having at this situation.
EURCHF on the 1H time-frameEURCHF on the 1H time-frame
The price still running downtrend by creating lower high and lower low then you can see the MACD is shown under the zero line that mean the Selling momentum still having at this moment.

GBPAUD on the 1H time-frameGBPAUD on the 1H time-frame
The price still running downtrend by creating the lower high and lower low and you can see the MACD is shown under the zero line that mean the Selling power still having at this stage.

GBPNZD on the 1H time-frameGBPNZD on the 1H time-frame
The price still running downtrend and you can see the MACD is shown under the zero line that mean the Selling power still having at this time.

GOLD on the 1H time-frameXAUUSD on the 1H time-frame
Just to move a trailing stop in order to lock your profit as a trading plan.

EURNZD on the 1H time-frameEURNZD on the 1H time-frame
The price is running strong downtrend and TP at the support line.

EURAUD on the 1H time-frameEURAUD on the 1H time-frame
Strong downtrend and running to the next support line.
