During a recovery from the 1-year low, should buy THETA coin?The theta network coin appears to be in recovery stage, just above the 2022 year's lowest trading zone.
Theta coin is watching near the 50-day moving average after maintaining a price above the 20-EMA.
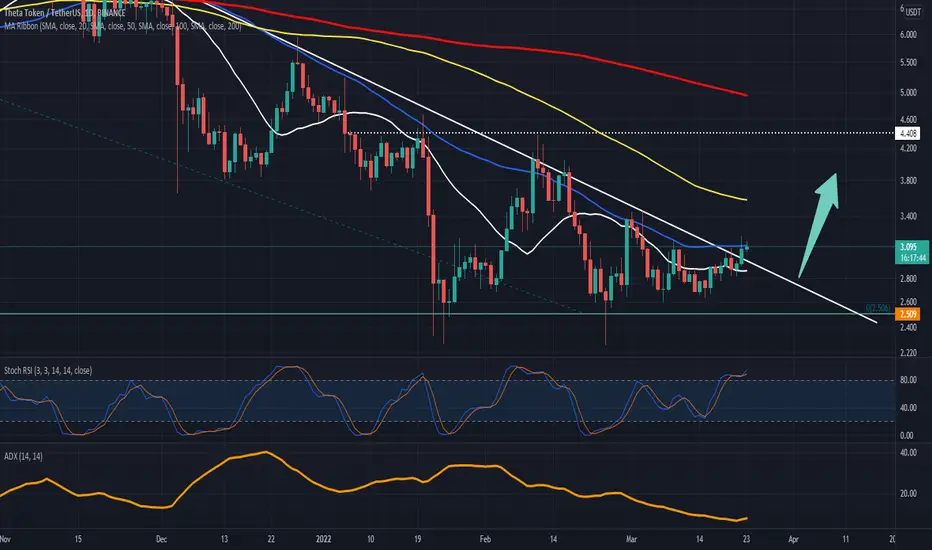
Stoch RSI provides notification of overbought areas in the context of the daily price chart.
Theta coin's daily price chart is trading above the 50-day moving average after the crypto price remained well above the 20-EMA line (white). The bulls need to cross the 50 EMA for further upside.
The Theta Network coin is trading at 0.00007357 satoshis concerning the bitcoin pair, which is up 3.79% in the green zone.
Stoch RSI is looking at the overbought area in the context of the daily price chart. At the time of writing, the values of the K and D lines seem to be above the 85-level.
The Average Directional Index (ADX) is trending lower and the ADX is now at 7-point, suggesting extreme sideways territory for the Theta coin.
Last night's bulls attempted to push the Theta network price higher but failed to close the daily candle above it. Now once again, buyers are aiming to manage the asset price above the 50-EMA. Traders should wait for confirmation above the bullish barrier before making any long positions.
Resistance level- $4.5 and $6
Theta
THETA TOKEN LOOKS GOODStatistically, late march is usually a good period to buy assets and hold for a while, and looking at THETA TOKEN from a weekly standpoint, it is wise to accumulate some if not much.

THETA - Final capitulationWe might be very close to Theta's final capitulation after more than a year in a descending triangle that became a falling wedge after December 2021. This projection hopefully comes with volume, which has been extremely low since a while

THETA decision soonTheta is approaching strong resistance from the top median line of the red downtrend Pitchfork as well as the center median line of the counter uptrend Pitchfork.
There's a demand zone marked by green rectangle that'll act as support as long as THETA doesn't get rejected hard by the top median line of the red Pitchfork.
Once it does break through, there's a supply zone above that'll likely trigger a pull back ideally to the re-test the top median line of the red Pitchfork before moving up.

THETA - StrengtheningAt the end of a positive week in THETA we see it break through to the upside of the Triangle formation that has dominated THETA for almost 12 months. It is now the 3rd day above the upper line of past-resistance and the longer it holds above that line, the better the bulls will like it. Volume is low at the moment though, so early days.

Theta Will Bounce SoonTheta Network is a solid one, with good fundamentals.
Metaverse, NFT's, Streaming, DeFI incoming, etc.
For now it's down 80% from ATH of last year. It's possible to have a rebound till 6$ minimum if btc settles in this area for a while.
Starting to accumulate at 3$ and below, till 2$.

THETA trying to breakoutTHETA is running into a wall of resistance; however, 2.83 seems to be holding for support. It's poised for a breakout as long as the support holds.

theta looking goodtheta is looking great to accumulate down here,
could potentially be close to breaking the down trend

THETA +1400% Target.Target: $34
Current Price: $2.72
+1400%
Modified Elliott Wave Fibonacci Analysis. Originally published in April 2021.

#THETA Symmetrical triangle Pattern #THETA horizontal triangle on the h4 timeframe, +45% if we break it by the top

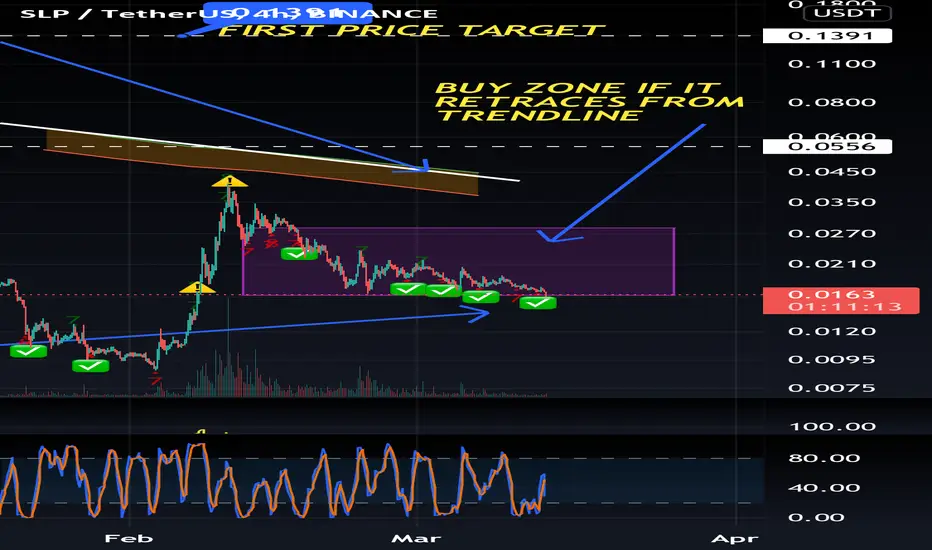
SLP is sitting right on support on 4hrTake a look at the buy zone for SLP on the 4hr…the DeMark 9 shows it’s go time, but if it were to break, $0.12 is next support.
THETA, key level FALSE BREAKOUT as a good BUY oportunity!The Theta Network (THETA) is now more in consolidation than in trend ( bullish or bearish ).
The $3-3.15 zone is now a resistance for about a month and a liquidity gap zone. We cannot break through that zone, because there is no BUYER above this levels at the moment.
After the breakout of the key level of $2.59, the big players can collect the traders' stop losses and it will be a good opportunity for us to take long positions.
Friends, push the like button, write a comment, and share with your mates - that would be the best THANK YOU.
P.S. I personally will open entry if the price will show it according to my strategy.
Always make your analysis before a trade.

Buying #THETA/USDT will PUMP$THETA Breakout Descending triangle
Expecting big upward move from here
MACD Bulliish cross over, good setup for entry
Target mentioned in the chart
Stop loss : $2.9

#Theta / #Usdt ❇️Buy zone 1 : 3.092~2.97
🎯Targets : 3.185 / 3.36 / 3.50 / 3.621 / 3.94 / 4 / 4.25
🛑Don't risk more than 3% of capital.

THETA Bullish Trend The first signals of an uptrend,
but the right area to buy the intersection of the support line and Fibonacci, is 1.7$
What do you think?

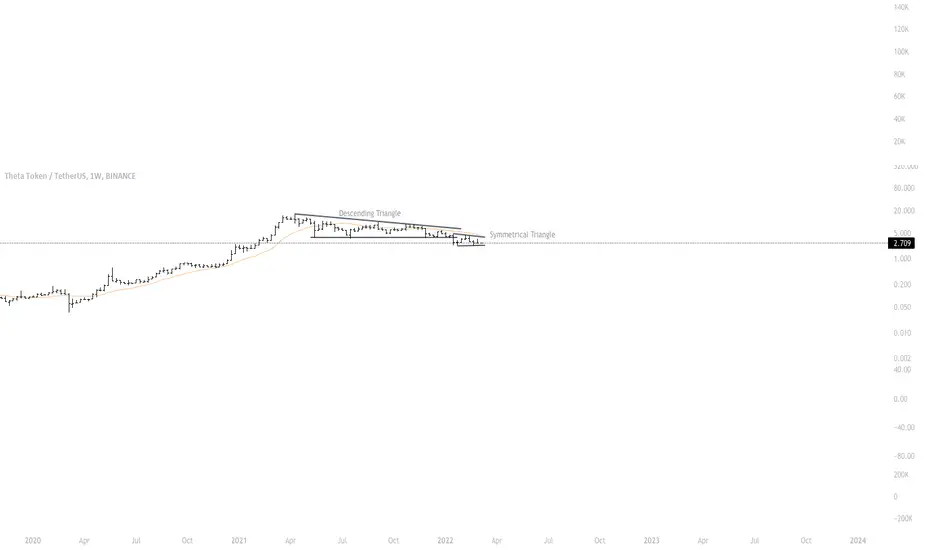
Theta: Symmetrical Trianglethe main pattern, descending triangle, has reached the middle of the target
now there is a symmetrical triangle forming which could lead to the continuation of the bearish trend if broken below 2.27 or upwards above 4.05
THETAUSDT - SETUPTHETAUSDT price has reached the apex of the triangle and now hovering around the critical support zone, but when the bulls will charge themself it is a big question. On the breaking of this triangle will leads to a good upside move, So be patient and wait for the price action

Drifting downward tomorrow. RVI is humping over, post is lowerContinuing to profit small on volatility and neutral plays

THETA - AnalysisOn a 4-hour timeframe, a suitable output can be seen from the two ranges of static and dynamic resistance, and it has targets of 3.11 and 3.75 in front of it. If it reaches the range of 2.5 and 2.6, it can be suitable for step entry.

$THETA/USDTTHETA after breakout still waiting for retest to take place right now we are above 0.61fib level probably we will bounce from this level or we could make a deviation to retest the trend line , but any place here it's good entry for THETA .

THETA up to break the triangle$THETA is up to break the long triangle. Will it break above finishing this long time of accumulation? The support at $2.3 did a great job holding, next resistance it's at $4.3 level, over that the volume should come in an hopefully break the triangle with a target t $14.

Theta Breakout on the Horizon!!?Theta is starting to look good we are currently trading inside of a bullish triangle sort of a larger scale one but we are steadily moving our way to the upside. We are currently battling a heavy resistance level and looking for a break to the upside, ultimately a break out and up of this triangle is the whole goal, now i wouldn't be surprised if we do overtake this current resistance level we have tested it multiple times and weakening it day after day recently! Now for support we are looking good we have the midline on the pivot bands which i will talk about next but we also have underlying support outside of this triangle, so a false breakout and bounce back in wouldn't be unheard of either. Now the pivot bands, same as the bollinger bands our midline currently serves as support and same goes if we break below it will then be resistance. But my main point with this indicator is that if we do slip out of the bottom of this triangle we will most likely see a bounce back in shortly after, price action touching the green band over and over shows a bounce is likely coming and vise versa with the red top band. Now our RSI is looking bullish aswell, we are finally above the midline once again and this reclaims a confirmed uptrend if we can hold above the 50. the midline serves as support aswell as the yellow SMA which is closely tailing the RSI slightly underneath! Overall we are looking bullish like the majority of the market and i think a breakout to the upside of this bullish triangle is likely coming soon in the next week or a bit more! Not financial advice just my opinion!

THETAUSD targeting $5.2250 on a fractal repeat.Theta Token is trading within a Channel Down and has just recently broken above its 1D MA50 (blue trend-line again). Even though the price remains just inside the Channel Down, that break-out on the previous similar Channel Down of April- July 2021 was a buy signal towards the 0.618 Fibonacci retracement level. That is currently at 5.2250. Notice how we are at the exact same RSI spot of that Channel Down break-out.
--------------------------------------------------------------------------------------------------------
** Please support this idea with your likes and comments, it is the best way to keep it relevant and support me. **
--------------------------------------------------------------------------------------------------------
