Theta - More Downside?Applying fib channel in this daily log chart we notice that the worst may still to come to THETA, lying right now at the support line of this channel that begun in late march.
Breaking this present support we have two others until $1.90.
It's also important to notice that for the first time since late april/20 THETA is below MA 200.
Unless it bounces hard on this level i'm bearish.
Thank you for reading.
Theta

Theta Network (THETA) - July 14Hello?
Welcome, traders.
By "following", you can always get new information quickly.
Please also click "Like".
Have a good day.
-------------------------------------
(THETAUSD 1W Chart)
If the price is maintained above the 2.94376146-4.33578821 section, we expect the uptrend to continue.
In particular, it is important to see an uptrend along an uptrend line.
(1D chart)
If the price is maintained in the range of 4.41735896-6.59972404, it is expected to turn into an uptrend.
In particular, we should watch to see if we can move up along the uptrend line.
If it falls in the range of 3.32617649-4.41735896, it is possible to enter the mid- to long-term investment area, so careful trading is required.
I expect the uptrend to be limited before breaking out of the two downtrend lines.
-------------------------------------
(THETABTC 1W chart)
If the price is maintained above the 12434 Satoshi point, it is expected to create a new wave. (Mid to long-term perspective)
(1D chart)
It turned into a downtrend as it fell in the 17437 Satoshi-19486 Satoshi section. (Short-term and medium-term perspectives)
If the price is maintained in the 12434 Satoshi-13341 Satoshi section, it is expected to turn into an uptrend.
In particular, it is important to see an uptrend along an uptrend line.
------------------------------------------
We recommend that you trade with your average unit price.
This is because, if the price is below your average unit price, whether it is in an uptrend or in a downtrend, there is a high possibility that you will not be able to get a big profit due to psychological burden.
The center of all trading starts with the average unit price at which you start trading.
If you ignore this, you may be trading in the wrong direction.
Therefore, it is important to find a way to lower the average unit price and adjust the proportion of the investment, ultimately allowing the funds corresponding to the profits to regenerate themselves.
------------------------------------------------------------ -----------------------------------------------------
** All indicators are lagging indicators.
Therefore, it is important to be aware that the indicator moves accordingly with the movement of price and volume.
However, for the sake of convenience, we are talking in reverse for the interpretation of the indicator.
** The wRSI_SR indicator is an indicator created by adding settings and options to the existing Stochastic RSI indicator.
Therefore, the interpretation is the same as the traditional Stochastic RSI indicator. (K, D line -> R, S line)
** The OBV indicator was re-created by applying a formula to the DepthHouse Trading indicator, an indicator disclosed by oh92. (Thanks for this.)
** See support, resistance, and abbreviation points.
** Support or resistance is based on the closing price of the 1D chart.
** All descriptions are for reference only and do not guarantee a profit or loss in investment.
Explanation of abbreviations displayed in the chart
R: A point or section of resistance that requires a response to preserve profits.
S-L: Stop Loss point or section
S: A point or section where you can buy to make a profit as a support point or section.
(Short-term Stop Loss can be said to be a point where profit and loss can be preserved or additional entry can be made through split trading. It is a short-term investment perspective.)
GAP refers to the difference in prices that occurred when the stock market, CME, and BAKKT exchanges were closed because they are not traded 24 hours a day.
G1 : Closing price when closed
G2: Opening price
(Example) Gap (G1-G2)

THETA buy zoneTHETA created a good entry point for trading. This is indicated by RSI hitting low and expected point of convergence for MACD as well as upcoming wave change, supported by EWO indicator (not on the chart) reaching it's bottom. All of that allows to expect trend change soon enough. Buy setup for that change:
Buy price: 5.545 - 5.565
TP: 5.619
SL: 5.185

#Altcoin overview 7.12.21Coins that look in my eyes
#SNX. #SOL, #Uni, #Theta
Open position in #GRT
cast my eye over
#fil
#ada
#ksm / #dot,
#klay
#cake
#trx
#cro

🆓THETA (THETA) July-12 #THETA $THETATHETA is struggling at the $6 zone and if it can't break through it it will correct to the $5 zone by mid-July or even the $4 zone. These are good buy zones that will definitely bring us good profits.
📈BUY
🔴Buy : 4.85-5.15$. SL if B
🔴Buy : 5.85-6.15$ if A. SL if B
📉SELL
🔴Sell : 5.85-6.15$ if B. SL if A
🔴Sell : 6.8-7.2$. SL if A`
♻️BACK-UP
🔵Buy : 5.85-6.15$ if A. SL if B
🔵Sell : 6.8-7.2$. SL if A
🔵Sell : 8.8-9.2$. SL if A
🔵Sell : 4.85-5.15$ if B. SL if A
🔵Buy : 3.9-4.1$. SL if B
❓Details
🕯Timeframe : 1 Day
📈Red Arrow : Main Direction as BUY and SELL section
📉Blue Arrow : Back-Up Direction as BACK-UP section
🟩Green zone : Support zone as BUY section
🟥Red zone : Resistance zone as SELL section
🅰️A : The Close price of candlestick is Above the zone
🅱️B : The Close price of candlestick is Below the zone

TFUEL ENTERED BUY ZONE JULY 5th #BTC ACTING AS ANCHORGood day, my crypto friends. Have you heard about #TFUEL or #THETA lately? Overlooked it perhaps?
In the News:
July 7th: Theta Labs Awarded 5th Patent
June 30th: Main Net 3.0 Launched
June 30th: Katy Perry Announced Launching NFT on Thetadrop.com in Q4 2021
What is happening?
Major New validator CAA joins on as 15th validator node. This is a Hollywood A-list celebrity talent agency. While coming at a time when Hollywood doesn't have a great reputation this shouldn't be ignored. Hollywood has no problem innovating to stay relevant and the possibilities of sweeping more cash away from fans for a digital rendering allah NFT's seems fitting. We'll likely see a major sports franchise follow suit if a moderate level of success is realized by CAA. *Speculation* likely the NFL or a co-sponsored relationship with Autograph (Tom Brady). Since Theta has added a 16th validator node with DHVC which is an asset management company.
Main Net 3.0 launched successfully. People are now earning more Tfuel for staking Tfuel. The Edge Node which is Theta Lab's software for harnessing broadband and computer resources has more nodes than the current job demand. Look for news that puts more work onto the Edge Nodes. Currently over 100k are operating and jobs are as infrequent as one or two a week. A moderate-sized project that would bump this up to a couple of jobs a day would be a huge boost here. The project needs more demand but not to much demand. This means companies like NetFlix and Youtube are not expected at this time, but a project like a beta test run through Vimeo or perhaps Rumble or Bitchute would grow demand sufficiently to get more nodes up and running for the big guns like Netflix, Youtube, TikTok or Twitch.
The stars are aligning . Both figuratively and literally. The news of CAA and Katy Perry's NFT project is the literal aspect, but figuratively the news is just as good. The 5th patent was announced today and behind the scenes partnerships keep emerging. While this is very good news for the Theta project as a whole, many small investors who got in during the All-Time-Highs (ATH) are becoming frustrated with the lack of progress in price.
The crypto market as a whole has been under attack by a fledgling system of corruption. This is evident by the fact that the system points to cryptos as enabling corruption. Standard playbook, blame others for what you're guilty of yourself. Decentralized currency is not good for the powers that were and whilst they still have some control they are exerting an ever-increasing attack on the crypto market. The question is, is the crypto market a massive snowball perched on the top of a mountain? Or has that snowball already started rolling?
What's up with BTC? And why the hell does it matter to Theta?
A longer look at BTC let's just say over the course of the last 12 months, shows BTC is actually doing quite well. Last year on July 8th BTC was around $9500. We're over 3x from that, which should put most short-term worries to bed. BTC is the mother of all crypto. This is why it is the focal point for attacks. China or Musk saying this or that, Markets creating BTC Futures and exchanges using leveraged trading are not designed to make the little guy any money. They are designed to control BTC to the best of their ability. What happens on most exchanges is coins are traded and viewed in pairs. This coin moves with that coin kind of thing. Because of this, generally speaking, good news in one crypto can't really translate when there is bad news constantly coming out for BTC. Which as I said in the opening statement and it's there for all to see, is it really isn't bad news.
The double-slit experiment.
The results of which change based on whether or not there is an observer. This means that results are dependent on observation. Take that one step further and you have scientific proof that by changing your observation you can change the results. What seems most logical to me, is that we as a whole need to stop paying attention to the BS being spewed by any MSM and even many Alt-Media types.
Evaluate honestly what crypto represents and can be, and you may see it as I do, a self-sustaining decentralized financial system that does away with the corporate bloat and governmental bureaucracy, and greed. By gathering a greater understanding of what crypto is, can be, and will be. We can more easily ignore the noise the previous establishment wants so hard to hang on to. Figuring out we really don't need central banks, credit card merchants, gateways all to take a cut of every dollar we earn and then subsequently spend is what crypto represents. Trading, futures, and exchanges are all ways for the "the man" to get his cut.
This information was presented in such a way to bring you to this final point about Theta / Tfuel. In my previous post, I outlined the fundamentals, all of which are still there now with even more arrows in that fundamental quiver. We have only seen good news about Theta, yet the price has gone down over the last couple of months and has been on a sideways trend since. All of this can be pinned on the exact same thing happening to BTC. But what is important to note here is that Theta/Tfuel and most crypto's for that matter are now at or around this year's all-time-lows. Which had somebody put this exact same information in your hands last year, in BTC's case you'd have still tripled your money. Think about that.
Well, thanks for taking the time, TFUEL isn't a big draw here, and while I spent a great deal of time writing this, I know it is going to go relatively unnoticed. For those who do notice I hope next year at this time, you can look back at this post and same damn, that dude was right. Hopefully not, damn that dude was right and I should have listened.
Be well,
Aired


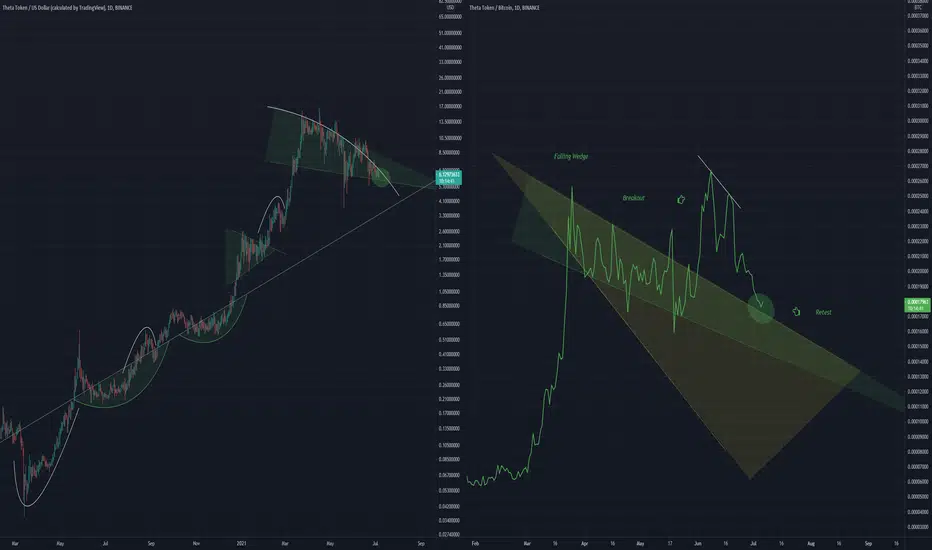
THETA AnalysisTHETAUSD is approaching a crucial point, it will likely break to the upside from this dominant position above the mean trendline of the current run
This breakout theory is exacerbated by the BTC pair which is retesting the top of a falling wedge, which is quite bullish for price and will likely result in a large bounce
I have not looked much into THETA technicals, this is my first analysis of the coin..
THETAUSD aiming at $35THETA has been trading within a Channel Up on the 1D time-frame (logarithimic scale) since the COVID bottom, with distinct Higher Highs and Higher Lows. At the moment it is trading almost on the Higher Lows trend-line and is on critical crossroads as the 1D MA50 (blue trend-line) is about to cross below the 1D MA200 (orange trend-line) and form the technically bearish formation of the Death Cross.
However, last time the 1D Death Cross was formed was back in the first week of April 2020, right after the COVID March Bottom and that turned out to be a strong Buy Signal instead. The CCI has also rebounded on the -290.00 CCI level which was the March 2020 COVID low.
Practically that means that if the Death Cross turns into a Buy Signal again, THETAUSD should go after a new Higher High within the Channel Up, and a $35.00 Target based on a 1.5 Fibonacci extension estimate would seem modest.
** Please support this idea with your likes and comments, it is the best way to keep it relevant and support me. **
--------------------------------------------------------------------------------------------------------
!! Donations via TradingView coins also help me a great deal at posting more free trading content and signals here !!
🎉 👍 Shout-out to TradingShot's 💰 top TradingView Coin donor 💰 this week ==> Pablito1986z
--------------------------------------------------------------------------------------------------------


THETAUSDTBULLISH FLAG PRICE ACTION
This chart pattern starts forming with bulls already in control of the exchange rate's sharp uptrend. When bears enter the market, trading is contained briefly in a down-sloped range. Bulls then break that range's upper resistance, and the exchange rate continues its uptrend.
Let's break down the pattern formation!
A sharp upwards price action is initiated from (1) till it finds the first resistance (2), creating the flag's pole.
Price action reverses direction from the first resistance (2) and starts forming lower highs and lower lows in a narrow flag-like formation, till it finds the lowest support in that formation at point (3)
The pattern is completed when price action reverses direction from the lowest support (3) and goes upwards till it breaks the flag's upper border at point (4)
Entry: after breaking the flag's upper border at point (4)
Take profit: identified by measuring the flag's pole height, which is the vertical distance between points (1) and (2), that measurement is then applied from the breakout rate (4)
Stop loss: the flag's lowest low (3)


THETAUSDTDOUBLE TOP PRICE ACTION
This chart pattern starts forming with bulls already in control of the exchange rate's uptrend. Bears make a stand at a certain rate that will be tested exactly twice before they are finally able to reverse direction, and the exchange rate starts a downtrend.
Let's break down the pattern formation!
In an uptrend, price action finds the first resistance (1), which will be the horizontal resistance for the rest of the pattern formation.
Price action reverses direction from the first resistance (1) and goes downwards till it finds support (2), which will be the only low in the pattern.
Price action reverses direction from support (2) and goes upwards, till it finds the second resistance (3), which will be around the same rate of the first resistance (1)
The pattern is completed when price action reverses direction from the second resistance (3) and goes downwards till it breaks the pattern's lower border at point (4)
Entry: after breaking the pattern's lower border at point (4), either with an entry after the breakout, or after a possible retest of the lower border.
Take profit: identified by measuring the vertical distance between the pattern's upper and lower borders, that measurement is then applied from the breakout rate (4)
Stop loss: the pattern's lower border, which is identified by point (2)


Theta Network (THETA) - June 27Hello?
Traders, nice to meet you.
Follow to get new information quickly at any time.
Please click "Like" as well.
Have a great day today.
-------------------------------------
(THETAUSD 1W Chart)
Because the wave is not completed, you can see the supporting section.
However, if the price is maintained above 4.33578821, it is expected to continue the upward trend.
(1D Chart)
We need to see if we can keep the price at 6.59972404-8.78208911 and get out of the downward trend.
If it falls at 6.59972404, Stop Loss is needed to preserve profit and loss.
However, careful trading is required because it can rise along the rising trend line.
---------------------------------
(THETABTC 1W Chart)
We need to see if we can continue the upward trend with support from 18665 Satoshi-20984 Satoshi section.
(1D Chart)
We have to see if we can continue to rise along the upward trend line.
If it falls, make sure it is supported by the Satoshi section 17437-19486 Satoshi section.
If it falls from the 17437 Satoshi branch, Stop Loss is needed to preserve profit and loss.
------------------------------------------
It's better to make a deal that matches your average unit price.
This is because if the price is below the average unit price, which has been on the rise and falling trend, there is a high possibility that the psychological burden will not make a big profit.
The center of all transactions starts with the average unit price at which you start trading.
If you ignore this, you can proceed with the transaction in the wrong direction.
Therefore, it is important to find a way to lower the average unit price and control the portion of the investment, ultimately allowing the funds to generate revenue on their own.
---------------------------------------------------------------------------------------------
** All indicators are posterior indicators.
Therefore, you should be aware that the indicators move according to the price and volume of transactions.
I'm just talking upside down for an interpretation of the indicators for convenience.
** The wRSI_SR indicator is an indicator created by adding settings and options from an existing Stochastic RSI indicator.
Therefore, the analysis is the same as the existing Stochastic RSI indicator. (K, D wires -> R, S wires)
** The OBV indicator was re-created by applying the expression DepthHouse Tracking, which is an indicator released by oh92. (Thank you for this.)
** Check support, resistance, and abbreviation points.
** Support or resistance is based on the closing price of the 1D chart.
** All descriptions are for reference only and do not guarantee gains or losses on investment.
Abbreviation description shown in chart
R: A point or section of resistance that requires a response to preserve revenue.
S-L : Stop Loss Point or Section
S: Points or intervals that can be purchased to generate revenue from support points or intervals
(Short-term Stop Loss is a point where a split transaction can preserve gains or losses or further entry. It's a short-term investment perspective.)
GAP refers to the difference in prices that occurred when closed because the stock market, CME, and BAKT exchanges do not trade 24 hours a day.
G1: Closing price when closed.
G2: Poetry at the opening.
(e.g.) Gap (G1-G2)

TFUEL | Theta Fuel Price Prediction By Japan Crypto Masters Theta Fuel (TFUEL) is one of the two native tokens on the Theta blockchain.
TFUEL is the governance token of the Theta blockchain supported by thousands of community-run Guardian nodes and its Enterprise validators including Google, Binance, Blockchain ventures, Gumi and Samsung.


TFUEL about to break out!!!!With Mainnet 3.0 right around the corner (less than a week away) this pattern is looking to hopefully break out soon, like within a day or so. Hopefully we see it shoot up today! Short term target near 60 cents.


Theta And TFUEL | Watch Out For Another BreakoutHey dear friends, hope you are well, and welcome to the new update on Theta and Tfuel coins.
Release of Mainnet 3.0:
only 7 days are left in the release of Theta Mainnet 3.0 and we have already seen that Tfuel has broken out the resistance and rallied beyond $0.60 but Theta coin is still moving in a down channel and could break out the resistance so far.
Market crash and completion of bullish harmonic moves:
Yesterday there was a complete market crash and all the cryptocurrencies were moving down. Theta and Tfuel both also followed the market trend, but while moving down both cryptocurrencies completed the bullish harmonic moves. The Theta formed a bullish BAT and Tfuel formed a bullish Shark pattern.
Shark move of Tfuel:
Bullish BAT move of Theta:
Tfuel re-tested the resistance as support:
The price action of Tfuel found a strong resistance after 13th March. Finally, the priceline broke out this resistance in the month of June. After that, it has re-tested this previous resistance as support three times. But this support is very strong and is not broken down even after several attempts. Every time when the Theta fuel moves to the upside from the support, it is getting rejected again and again by the $0.60 resistance level. Now after the recent bounce from the support we can expect that the price action of the Tfuel can make another attempt to break out the resistance of $0.60.
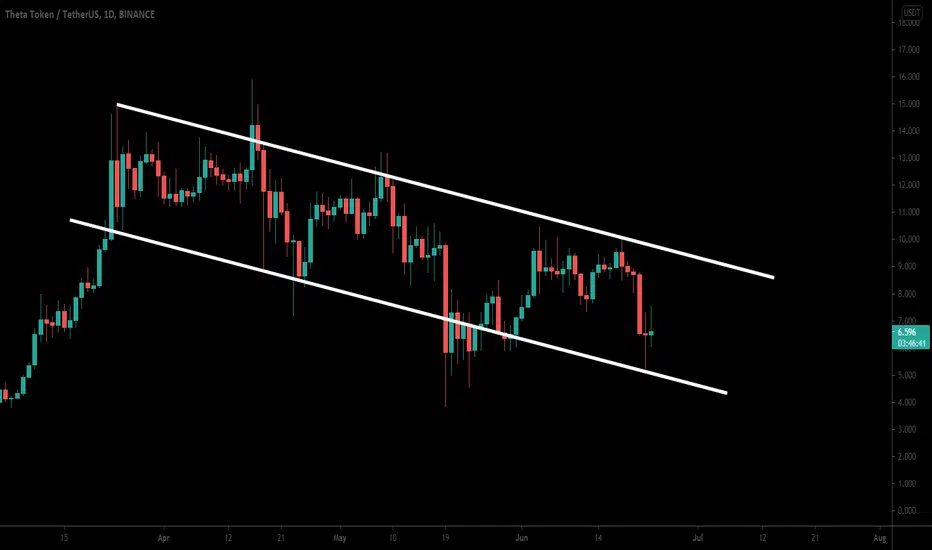
Theta has reached the support of down channel:
On the daily timeframe chart, the price action of the Theta coin has formed a down channel. The formation of this channel was started in the month of March 2021. The price action of Theta is moving between the resistance and the support of this channel very well. Now recently the price action is getting bounced by the support and we can expect that while the Tfuel is moving up to hit the $0.60 resistance at the same time the Theta can also make another attempt to break the resistance of this channel.
Conclusion:
The price actions of Theta and Tfuel both coins have formed the bullish harmonic moves at the same time. Whilst the price actions of both cryptocurrencies are at the strong supports. Therefore, this time this bullish bounce can lead them to break out the next resistance levels.
THETA - Correction Before Major UpgradeAnalysis:
- Fibonacci Retracement
- Support & Resistance
- Order Block Flow Analysis
- Market Structure
Target: $2.01
Opinion:
If you go to Theta's website they have a timer counting down to their Mainnet 3.0 Launch in 20 Days!
I believe they will make another drop before this news is announced to wash out the paper hands
Once they are done correcting I will be looking for buys and I will do a follow up bullish markup
If you haven't done your research on this coin, I highly recommend you do :)
This is top 3 on my list for sure and I am so glad I am able to buy at discounted prices
Accumulate Accumulate Accumulate


THETA formed a bullish Cypher for upto 21.5% moveHi dear friends, hope you are well, and welcome to the new update on Theta coin.
Previously on 21th May, we had a nice harmonic trade of Theta:
Now on the 12-hour time frame chart, the price action has formed a big Cypher pattern.
