DETAILED LIVE VIDEO- What to Buy on This Dip now?Our detailed video with updated charts on the 10 major cryptocurrencies.
Earlier today you had been warned at a PERFECT TIME about ETHEREUM, just a few minutes before it dipped. Now is time to examine the options of buying something after this dip.
BNB, Litecoin and Ripple seem to be good options but REMEMBER:
You buy the dip, if the price breaks this support levels get out and buy again on next support. If the price goes up, remember to take profits at the next resistance.
Hope it helps guys
One Love,
the FXPROFESSOR
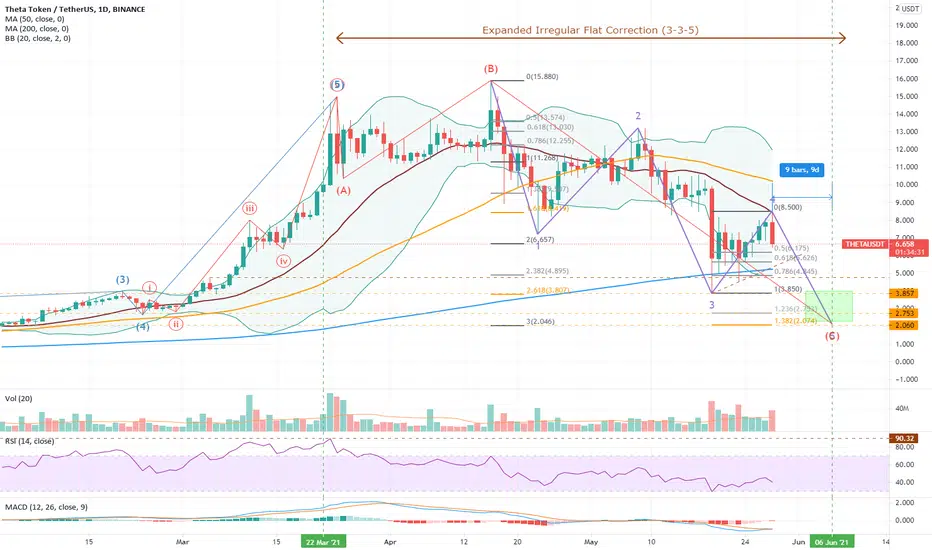
Theta

THETA HAS A HUGE POTENTIAL!!!On this analysis, I would like to share my opinion on Theta Coin.
I'm not a fundamental guy, mostly my analysis is coming from the chart, and what I found on the chart is quiet surprising.
First of all, a Descending Broadening Wedge Pattern is forming in the Daily Timeframe, this pattern shows a bullish indication after the Breakout on the Resistance.
But, I also saw a Rising Wedge Pattern forming that give us a sign for a further correction before we can see the Bullish continuation comes back on.
Disclaimer: This content is not a Financial Advise.

THETA / USDT - Watch for BreakoutTHETA has been one of the altcoins that's had a pretty rough fall from grace during the May crash. I don't know much about the project itself, other than it has a strong community. Lots of stakers. Similar to LUNA , in that regard.
You can see some levels here on the 6-hour Chart . I've added in "price projections" using the Musical Harmonics indicator, which has proved itself solid in the crypto space. Idk why.
Either way, if THETA breaks out above $10.02 here this Week / today, here's how I'm going to be playing it.
If BTC and ETH both fail here this Week, then it's going to be more downside--or, at best, sideways action.
If we see *either one of those* King Coins shoot their shot, THETA will erupt.
Mark my words.
Well, I'll just mark them myself by publishing this chart.
This is not financial advice.
Again, I don't know anything about THETA other than its chart over the past couple of weeks has looked increasingly Bullish .
That being said, I've been very tuned-in during this past year especially, and have a fairly good feel for the crypto space. The Laws of Physics need not apply here.
Remember how AAVE and MKR were front-running every other coin earlier this year? Those two may be headed for Round 2, for sure, but THETA's looking willing and able to throw its hat into the ring here as well. MATIC has spiked, sure, but then it's also spiraled right back down pretty quick. THETA 's actually "held the line", literally, pretty well.
Also again: first watch BTC , ETH , ETHBTC .
If any of those start to breakdown, or stall out against resistance, exit stage right.
Presuming we swing back into " DeFi Summer 2.0 " ( note: watch the DeFi Exchange Tokens, like UNI , SUSHI , 1Inch , CAKE , etc leading up to EIP-1559 ), THETA will leave this earth's orbit on its moon mission. Like, Ganymede .
🚀🌜👍

Theta and Tfuel a big move expectedWelcome to the new update on Theta and Tfuel.
The Theta Mainnet 3.0 is scheduled to be released on the 30th of June, therefore Theta and Tuel both can make big moves before this event.
Tfuel breakout of broadening formation:
The price action of Tfuel has broken out the resistance of a broadening formation.
Now we have the price level resistance at $0.46.
Today the price action is also breaking out the $0.46 if the daily closing will be above $0.46 then it can be ideal buying.
The technical target of this pattern is $0.60 however, there is Theta Mainnet 3.0 release expected on 30th of June. Therefore we can expect higher profits.
The previous resistance of this broadening formation can be used as a stop loss and the previous price level support of $0.40 can also be used for this purpose.
Tfuel and the different SMAs:
The price action of Theta Fuel has also broken out the different simple moving averages on the daily time period chart, like, 25, 50, 100, and 200.
Theta reached the resistance of channel:
The price action of Theta has formed a down channel on a daily time frame.
Within this channel the price action of Theta first formed a falling wedge and after breaking down the support of the wedge it formed another bullish pennant.
Now the price action is breaking out the resistance of the bullish pennant. If the pennant will be broken out then the price action can easily break out the resistance of the channel as well.
Theta and the different SMAs:
On the daily time frame chart, the price action of Theta has taken a nice bounce from 200 SMA, and now while it is breaking out the bullish pennant at the same time it is also breaking out the 25, 50, and 100 simple moving averages.
Conclusion:
Before the previous event of Theta 2.0 Mainnet launch, the price action of Tfuel produced more than 1200% profit and Theta generated more than 700%. Therefore this time we can expect that Tfuel can produce more gains than Theta.

Theta Network (THETA) - June 7Hello?
Welcome, traders.
By "following", you can always get new information quickly.
Please also click "Like".
Have a good day.
-------------------------------------
(THETAUSD 1W Chart)
If support is found above the 7.12330856 point, we expect the uptrend to continue.
(1D chart)
We should see support at the 8.78208911 point and see if we can move above the 9.87327158 point.
If it falls from the 6.59972404 point, Stop Loss is required to preserve profit and loss.
-------------------------------------
(THETABTC 1W chart)
It remains to be seen if the price can be maintained above the 18665 Satoshi-20984 Satoshi section.
Since it touched near the 12434 Satoshi point and rose, I think the possibility of a second wave of an upward wave falling below the 12434 Satoshi point is open.
If the 12434 Satoshi point is falling to find support, it is important to see if it can move up along the uptrend line (1).
(1D chart)
We will have to wait and see if we can move above the 25631 Satoshi point along the uptrend line.
If it falls from the 17437 Satoshi point, Stop Loss is required to preserve profit and loss.
------------------------------------------
We recommend that you trade with your average unit price.
This is because, if the price is below your average unit price, whether it is in an uptrend or in a downtrend, there is a high possibility that you will not be able to get a big profit due to the psychological burden.
The center of all trading starts with the average unit price at which you start trading.
If you ignore this, you may be trading in the wrong direction.
Therefore, it is important to find a way to lower the average unit price and adjust the proportion of the investment, ultimately allowing the funds corresponding to the profits to regenerate themselves.
------------------------------------------------------------ -----------------------------------------------------
** All indicators are lagging indicators.
Therefore, it is important to be aware that the indicator moves accordingly with the movement of price and volume.
However, for the sake of convenience, we are talking in reverse for the interpretation of the indicator.
** The wRSI_SR indicator is an indicator created by adding settings and options to the existing Stochastic RSI indicator.
Therefore, the interpretation is the same as the traditional Stochastic RSI indicator. (K, D line -> R, S line)
** The OBV indicator was re-created by applying a formula to the DepthHouse Trading indicator, an indicator disclosed by oh92. (Thanks for this.)
** See support, resistance, and abbreviation points.
** Support or resistance is based on the closing price of the 1D chart.
** All descriptions are for reference only and do not guarantee a profit or loss in investment.
Explanation of abbreviations displayed in the chart
R: A point or section of resistance that requires a response to preserve profits.
S-L: Stop Loss point or section
S: A point or section where you can buy to make a profit as a support point or section.
(Short-term Stop Loss can be said to be a point where profit and loss can be preserved or additional entry can be made through split trading. It is a short-term investment perspective.)
GAP refers to the difference in prices that occurred when the stock market, CME, and BAKKT exchanges were closed because they are not traded 24 hours a day.
G1 : Closing price when closed
G2: Opening price
(Example) Gap (G1-G2)

THETA - Weekly MACD Confirms Fall Into AbyssTitle says it all. MACD has crossed for the first time this year. There's no coming back from this, it is a reversal and I will be looking to buy for pennies down the road.
I first called THETA top at $12 before the crash and can you imagine received a lot of unhappy comments.

THETA - A Risky But High RR ShortSome frothy ALTs have been pushing up while BTC looks very corrective hovering around 0.618 of the previous local peak. Reasonable chance THETA will tag 0.886 from the top-to-crash-bottom before heading down. Also if recent price just printed a minute wave 2 then a 5th wave would almost exactly hit the 0.886 at $13.5. I have a small short order in this area.
Not advice.

THETA/BTC last resistance THETA / BTC
Despite the drop in USDT pair
In BTC pair we see THETA almost touched ATH again !
it already brokeout a bull flag or decending channel
The last resistance for it is previous ATH ...After Breaking this resistance it can fly easily
It can also retest 0.00021 level which is very important level to hold for continuation of bullrun in this coin
Invalidation : daily close below 0.00021
Dont forget to like my ideas for more good calls and analysis 🙏

Tfuel 26 days to Main Net 3.0 = Sleeping Godzilla?!Hi, thank you for reading this idea!
we are looking at the Daily timeframe.
as you can check on the official Theta Lab Website (www.thetatoken.org), We have only 26 days left To the lunch of Mainnet 3.
as you may not know: this update is focusing on the Tfuel Staking through their Edge Node and etc.
Based on the Ichimoku cloud, there are two points that I have marked in the chart that we have to watch carefully.
if the Ichimoku completes its move to the upside, a Massive Price break out is very possible.
This is only an Idea, Always stick to your own analyses, keep studying charts and
Wish you all the bests.

Alert Rocket Ship Pattern Forming TFUELAfter a long trying anaylsis of the charts, I have discovered a Rocket Ship pattern emerging in the TFUEL market.
The Rocket Ship pattern is one of the rarest patterns in chart analysis, because it has very little to do with chart anaylis and more to do with project analysis.
Mainnet 3.0 JUNE 30TH 2021
When you see a Rocket Ship pattern it is best to load up, strap in and HODL on!
Come back July 1st to see if we made it to Adromeda Galaxy or have simply stopped at the edge of the Milky Way for some RR.

ThetaBTC going long Theta just broke out again in BTC pair... target is set measuring the pole without the wick, although we could be witnessing a new ATH for Theta this time, but still I am playing it safe here.
What do you think? Will there be a new ATH record here, or will BTC volatility cut it short?

💡THETA: BUY Trade "Theta Mainnet 3.0 on 30 Jun 2021"Theta Mainnet 3.0 is going to be released at June 30 instead of 21 April 2021.
Before June 30 Consider for Profit Booking...
📈#THETAUSDT
➡️Entry: 7.5$
🎯Target 1: 10.1$
🎯Target 2: 12.6$
🎯Target 3: 14.5$

THETA/USDT rounded bottom If the pattern can hold, theta could make a big move today. Rounded bottom almost complete which is bullish.
I'm waiting to see if it can closed above the breakout line, that will set up a test of target 1 .

THETA - Make Or BreakTheta is at a critical level at the moment. It's facing the 100EMA dynamic resistance and previous structure at $8.50 level. If we manage to break that level, we can consider buying Theta. Until then, it looks very corrective and bearish and we could see a move lower.
Keeping a close eye on the $8.50 level to see how price reacts.

The most bullish chart in crypto!Hi crypto traders,
Using the Anchored VWAP, we can clearly see that we are in a bullish macro trend but short term correction. Bulls are in control and we will not close on the daily lower then 2.7usd.
Price targets for THETA are just mind-blowing. We could see even 200usd per THETA. But better exit, it will be once the price touches again the yellow log scale up trend
Thank you,

THETAUSDTHello to you all. Mars Signals team wishes you high profits at all times.
The price has lost its support and is starting to move down. We wait for the price to break its resistance and then we enter the trade. We have identified the next resistance for you that we can make a profit in that area. And we have specified the support for you that can be supported in case the price falls.
Warning: This is just a suggestion to you and we do not guarantee profits.
Wish you luck!

THETA - An irregular flat predictionJust an Elliot Wave projection using a Ichimoku number to forecast the pivot low. However, there are many Ichimoku numbers.
What do you think, will THETA drop to $2.10?
THETA 1D Where to sell and where to buyLet's take another look at THETAUSDT on the global chart today
Since the 75% drain of the coin cooled the dust of small investors a little.
First, let's look at our previous idea THETAUSD , which was published 2 months ago.
Then we wrote that if the price is kept above $11, then there will be a chance for growth to $18. We did not see $18, but the market fixed the maximum +45% at $15.88.
And then the price was drastically lost in two passes. We should recall the words from the last sentence of the previous idea: "a cool head suggests that big money went to THETA in the region of $2"
The minimum price of THETA during the drain was $3.85 and then a corrective rebound began, which continues to this day.
An important area on top is $9.15-11.30 , where current growth can be expected. It is hard to believe that the THETAUSDT price will break this zone up from the first time.
And then we again return to the liquidity zones from the bottom, where the coin was bought with a lot of money.
The first zone is $1.50-2.40
The second zone is $0.55-0.75
(of course, sellers will first need to push the price below $4)
For the future, place buckets for purchases in these zones if the negative background continues to push cryptocurrency prices down.
P.S:
Let's not say that we want these prices, but theoretically, they are real on the crypto market because the price of THETAUSD has grown from $0.04 to $15.88 in a year.
_____________________
Since 2016, we have been analyzing and trading the cryptocurrency market.
We transform our knowledge, trading moods and experience into ideas. Each "like under the idea" boosts the level of our happiness by 0.05% . If we help you to be calmer and richer - help us to be happier :)

THETA - The Bigger They Are The Harder They FallI'm not shorting THETA but as with all alts it is on the brink of collapse right here. Tagged the 0.886 as did many others, I doubt it will go higher. Price could really collapse here in tandem with Bitcoin capitulating out of a wave 4 flat correction into a devastating wave 5. See my Bitcoin thread below for details.
@kevlemarin,

"Gas" token are bullish"Gas" tokens are pumping today. ONG showing the best performance. Probably will come back to 2100 / 1800 where it will be the best buy. Pay attention to ONT as well.
TFUEL can be picked at 660 / 620. Pay attention to THETA as well.
GAS at 2600 / 2300. Pay attention to NEO as well.

Theta Network (THETA) - May 22Hello?
Dear traders, nice to meet you.
By "following" you can always get new information quickly.
Please also click "Like".
Have a good day.
-------------------------------------
(THETAUSD 1W chart)
(1D chart)
It remains to be seen if it can rise above the 6.75133141 point along the uptrend line.
If it falls this way, you can touch the 4.33578821 point, so you need to trade carefully.
In order to turn to an uptrend, it must rise above the 8.78208911 point and be supported.
The next volatility period is around May 25th.
--------------------------------------
(THETABTC 1W Chart)
(1D chart)
We must see if we can quickly ascend above the 17437 Satoshi point.
If it falls this way, you can touch the 13341 Satoshi point, so you need to trade carefully.
In order to turn to an uptrend, it must rise above the 18665 Satoshi point and gain support.
--------------------------------------
It is advisable to trade at your average unit price.
This is because if the price flows below your average unit price, which was on an uptrend or downtrend, there is a high possibility that you will not be able to earn a large profit due to the psychological burden.
The center of every trade starts with the average unit price you start trading.
If you ignore this, you may be trading in the wrong direction.
Therefore, it is important to find a way to lower the average unit price and adjust the proportion of the investment, so that the money that ultimately corresponds to the profit can regenerate the profit.
-------------------------------------------------- -------------------------------------------
** All indicators are lagging indicators.
So, it's important to be aware that the indicator moves accordingly with the movement of price and volume.
Just for the sake of convenience, we are talking upside down for interpretation of the indicators.
** The wRSI_SR indicator is an indicator created by adding settings and options from the existing Stochastic RSI indicator.
Therefore, the interpretation is the same as the conventional stochastic RSI indicator. (K, D line -> R, S line)
** The OBV indicator was re-created by applying a formula to the DepthHouse Trading indicator, an indicator that oh92 disclosed. (Thank you for this.)
** Check support, resistance, and abbreviation points.
** Support or resistance is based on the closing price of the 1D chart.
** All explanations are for reference only and do not guarantee profit or loss on investment.
Explanation of abbreviations displayed on the chart
R: A point or section of resistance that requires a response to preserve profits
S-L: Stop Loss point or section
S: A point or segment that can be bought for profit generation as a support point or segment
(Short-term Stop Loss can be said to be a point where profits and losses can be preserved or additionally entered through installment transactions. It is a short-term investment perspective.
GAP refers to the difference in prices that occurred when the stock market or CME and BAKKT exchanges were closed because they are not trading 24 hours a day.
G1: Closing price when closed
G2: Cigar at the time of opening
(Example) Gap (G1-G2)
Theta formed bullish Shark for upto 79.5% rallyHi friends, hope you are well and welcome to the new update on Theta coin.
The previous trade setup of Theta produced nice profits:
Now this time on a 2-day chart, the price action of THETA has formed a harmonic bullish Shark pattern.
Buying and sell targets for Shark move:
Buy between: $7.77 to $6.54
Sell between: $9.08 to $11.77
Stop loss:
The maximum extent of the potential reversal zone to $6.54 can be used as a stop loss.
Possible profit and loss ratio:
As per the above targets, this trade has a profit possibility of 79.5%, and a high loss possibility up to 16%.
Note: Above idea is for educational purpose only. It is advised to diversify and strictly follow the stop loss, and don't get stuck with trade.
