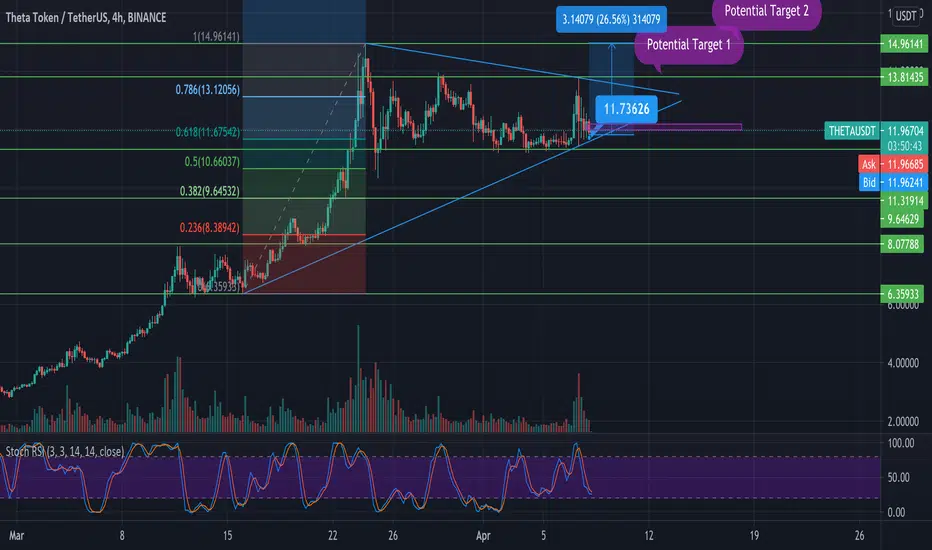
THETA/USDT Prediction AnalysisGood Morning to all respected Investors and Traders,
I made a simple analysis for THETA/USDT
I reckon you guys to entry at 11.7-11.9 USDT
Take profit at my potential target 1 and 2..
Make your own analysis sounds better and kindly please sharing this link..
Critiques and comments are super appreciated
Thank You! Happy trading y'all and good luck!
Best,
PS: This is not financial advisor. Please DYOR before entry the market
Theta

Theta: long!Only if it closes above the box.
Then wait for the retest of the box to enter long.
Please hit LIKE if you find this useful!


It’s Thetas turn againSymmetrical triangle breakout. Wait for confirmation but this is looking like it’s ripe for another run.

🌧️ THETA Possible BreakoutTHETA has seen some considerable gains recently, but there could be more. THETA is developing a large bullish flag, and a breakout of the descending wedge could signal more upside. Watch for a breakout approaching the end of the flag and ensure that it finds support around the $12.12-$12.66 levels. From there, we can expect a rise to $17.8 or even $22.4 depending if you go by the length of the flagpole or the height of the flag (:
This could be a huge buying opportunity alongside news of THETA's NFT marketplace dropping by 26 April, giving hints at a bullish rise.

THETA BREAKOUT: new ATH coming this week!THETA just broke out of its bullish triangle with a new ATH as a target.
BREAKOUT CONFIRMED:
- Good volume
- Retested resistance as support.
- MACD cross
Big move incoming, lets go!
IMPORTANT: this is not financial advice, trade or invest at your own risk and research.

THETA.USDT (Y21.P2.E2).Hold on.Hi Traders,
This is a continuation of the previous post, the story just started.
It was covered in the video post
Patience with strategy is profitable, especially in trading.
Now hold on and lets hope it rockets amazingly.
For those who have not invested or held the dip, last chance.
All the best,
S.SAri

Theta situation after it comes out of the gray zone and break the white line , it will achieve the goals we set


🌧️ TFUEL In Bullish ChannelTFUEL has been in a bullish channel for a while now. Assuming the bullish channel holds, TFUEL is expected to move upwards together with the release of an NFT marketplace for THETA by 25 April. For less risk, wait for a breakout on the local wedge and ride it to the top of the bullish channel.

THETAUSDTHello to you all. Mars Signals team wishes you high profits at all times.
We are in daily timeframe and experienced a good climb, but the price is suffering and trapped inside the triangle, like our previous analysis, we intend it can break its triangle up and touch the targets over time, but We have drawn a support line for you, which is a good support
Warning: This is just a suggestion to you and we do not guarantee profits.
Wish you luck!

THEAUSDT > Is Another Break To The Upside Possible!?I hope you are feeling generous and loving today to give me a like and leave a comment it will really support the creation of new free ideas for you.
Analysis up on #THEAUSDT
Hello friends.
If you know about Theta you know it is unique in so many cases that are related to streaming, Theta dose does not seem to run out of good news that helping the price to increase further.
Looking at the chart I see the market is moving sideways inside a wedge and if you are familiar with this pattern you will know it breaks to the upside most of the time.
This is technical analysis, that should not be the only reason to consider getting in this market, I am in it already from well below this price and I am not considering getting out unless a dramatic change to the crypto market accrues.a
Safe trading everyone
Check today analysis below⠀
>> you must know what is your risk before you get in a trade, many traders will only look at how much they will get
_____________________________________________________________________________⠀
-Disclaimer: This information is not a recommendation to BUY or SELL. It is to be used for educational purposes only⠀
-Please note this is just a PREDICTION and I have no reason to act on it and neither should you

Theta Trend OverviewOriginal uptrend started march 6th, we wicked below but are closing above it on the 4hr chart. So far respecting $11.25 resistance.

Next 100% fib move for THETAThough currently in a consolidation phase, then next leg up for theta could easily go to 22.18 level before any significant pullback, though could go as high as 35-ish.
I'd love to hear what other people have come up with as well.

Buy the dip in ThetaExpecting a move up to the resistance around 13.5 region after bouncing off the fan line...
Indicators still pointing upwards
A close above that black resistance will be highly bullish for the next move higher.

Theta Network (THETA) - April 3 Hello?
Dear traders, nice to meet you.
By "following" you can always get new information quickly.
Please also ask for the "Like" clock.
Have a nice day.
----------------------------------
We need to see if we can get support at the 11.70032876-12.28271372 section and move up along the uptrend line.
If you decline at 10.53555876, you need a short stop loss.
In the CCI-RC indicator, it remains to be seen whether the CCI line can break above the EMA line.
It is important to get support above the 11.22403904 point.
-------------------------------------
(THETABTC 1D Chart)
We'll have to see if we can get support on the 0.00019655-0.00020591 section and climb along the uptrend line.
If you fall from the 0.00017785 point, you need a short stop loss.
--------------------------------------
If you look at the charts of most of the major coins, they are either rising near their previous highs or exceeding their previous highs.
These rises are expected to rise even more when the BTC price rises above 60K and moves towards 70K.
However, if the BTC price fails to rise to 60K, it is expected that it will eventually turn into a downtrend, so careful trading is necessary.
Currently, BTC is in the period of volatility, and the coin market is in the overheating zone.
In this market situation, if you enter along with rising prices, the rate of return may be negative.
The coin price is recording positive, but the yield of the coin I bought is negative.
Therefore, if you are not familiar with same-day trading or short-term trading, it is recommended to enter when the coin price declines and then moves sideways and shows support at some point.
-------------------------------------------------- -------------------------------------------
** All indicators are lagging indicators.
So, it's important to be aware that the indicator moves accordingly with the movement of price and volume.
Just for the sake of convenience, we are talking upside down for interpretation of the indicators.
** The wRSI_SR indicator is an indicator created by adding settings and options from the existing Stochastic RSI indicator.
Therefore, the interpretation is the same as the conventional stochastic RSI indicator. (K, D line -> R, S line)
** The OBV indicator was re-created by applying a formula to the DepthHouse Trading indicator, an indicator that oh92 disclosed. (Thank you for this.)
** Check support, resistance, and abbreviation points.
** Support or resistance is based on the closing price of the 1D chart.
** All explanations are for reference only and do not guarantee profit or loss on investment.
Explanation of abbreviations displayed on the chart
R: A point or section of resistance that requires a response to preserve profits
S-L: Stop Loss point or section
S: A point or segment that can be bought for profit generation as a support point or segment
(Short-term Stop Loss can be said to be a point where profits and losses can be preserved or additionally entered through installment transactions. It is a short-term investment perspective.)
GAP refers to the difference in prices that occurred when the stock market, CME, and BAKKT exchanges were closed because they do not trade 24 hours a day.
G1: Closing price when closed
G2: Cigar at the time of opening
(Example) Gap (G1-G2)

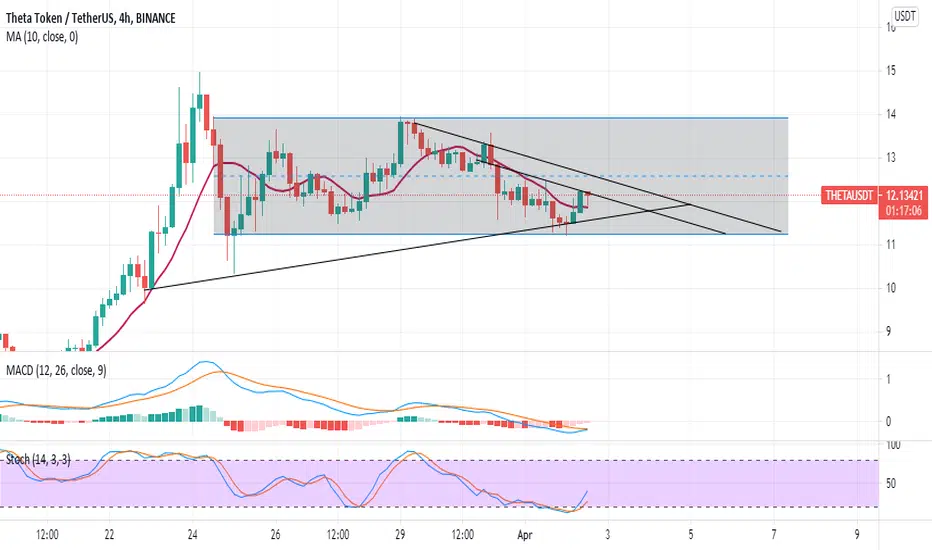
Theta on the moveTheta in USDT pair is moving in a horizontal channel since March 25th, got support from MA10 and now testing the descending local resistance. MACD and Stochastic indicators showing proper place to buy and profit from a short time trade.
Trade Safe
The new GODMODE Fractal is in play.. Tesla bottom signal!Hello crypto traders!
Let me give you some hope here for a green april with this potential fractal I have spotted on Bitcoin ... but first, what is a fractal?
From the TradingView page on Fractals itself:
" Fractals are not only abundant in nature, they are also the building blocks of trends. They are simple yet important, repetitive formations, self-similar across different time frames and used by traders to identify or conform a trend (markets trend about 30% of the time) in order to trade it profitably. When broken apart, they exhibit the same characteristics as greater patterns or price movements. Fractals lag the market, because it takes time for them to form. "
So a fractal is a repetitive formation that can be identical or have almost identical characteristics, playing out repeatedly over time.
_________________________________________________________________________________________________________________
In this current fractal on Bitcoin i can spot some key similarities in the Price Action now and January earlier this year:
( Price Action is the term used to describe the way the Candlesticks react to certain areas marked on the chart )
Timeline of events:
-Price formed a Symmetrical Triangle Pattern
-Price formed a small Head & Shoulders Pattern inside triangle
-Pattern broke downwards also losing horizontal SUPPORT area (Marked with red arrow)
-Downwards movement was quickly brought up with signs of institutional buying & interest
-Price then reclaimed support area and broke outside the Symmetrical Triangle (has not happened yet on the new formation) (Marked with green arrow)
----------------------------------------------------------------------------------------------------------------------------------------------------------------
The main characteristic is a Symmetrical Triangle Pattern , in this pattern the price swings with 5 almost perfect touches between a Symmetrical Triangle before "breaking out" either upwards or downwards out of the pattern. The breakout can "fail" and reverse in the other direction which is what the below Fractal is showing us can potentially happen again now.
The Symmetrical Triangle forms the beginning of this repeated "Price Action" we are looking for presently.
----------------------------------------------------------------------------------------------------------------------------------------------------------------
There is also a Head & Shoulders Pattern , in this pattern price forms 3 distinct peaks usually after a strong uptrend, the left and right peak should have a similar height (shoulders), the middle peak (head) has to be the highest or this can not be a HS pattern . They should seem triangular in appearance but as long as it fits the main characteristics can still be a valid pattern.
The Head & Shoulders leads to the downward breakout outside of the Symmetrical Triangle.
----------------------------------------------------------------------------------------------------------------------------------------------------------------
So you can see on the bottom left of the chart we eventually "reclaimed" the Support & Symmetrical Triangle before having a massive up move, right now it looks like we are setting up to do something similar here, but first we need to get back above the "Support" & Symmetrical Triangle areas.
----------------------------------------------------------------------------------------------------------------------------------------------------------------
Back around $35,000 we had the rumor followed by filing that Tesla brought Bitcoin:
www.cnbc.com
Now at the bottom of this current formation we have the news of Tesla accepting Bitcoin as payment:
www.cnbc.com
Do you really think one of the worlds Smartest & Richest men would want to accept an asset as payment if he believes it will depreciate in value?
-Trader Worth_The_Risk
_________________________________________________________________________________________________________________

THETAUSD BULL FLAG - SWING LONG #THETA #THETAUSDT #THETAUSD We can see Theta has formed a nice bull flag on the 4 hour chart.
If we apply Fibonacci from the swing high, to the swing low we can see that theta is bouncing in the golden pocket.
The 0.38% Fib is currently acting as support.
Stop losses should be placed below $11.57
We are targeting to sell the 0.618% Fib.
Following a break upwards, we will be looking to make a play on the breakout of the bull flag.
Will keep you updated.
Thanks.

Theta History and April predictions.Full overview of how I got to these conclusions in my video here---> www.youtube.com

THETA/USDTTake Profits:
SHORT TERM
TP1: 14.3
TP2: 17.9
LONG TERM
TP3: 22
STOP LOSS :
.If you want to trade short term below the downtrends triangle or SL1
.If you want to invest for the long term use your stop loss below 10 (SL2)
Thanks for your attention 🙏!
Trade well, ❤️

Tfuel/BTCits time to long on TF BINANCE:ONTUSDT UEL/BTC , it has 22% for ShortTerm Long & 52% MidTerm Long potential for pump this days( keep eyes on THETA for detail)
Entery Below 0.00000710
Targets:
TP1 :0.00000850
TP2 :0.00001400
BINANCE:TFUELBTC
