THETAUSDT 1WTHETA ~ 1W Analysis
#THETA Buy from here if you still have a Conviction on this coin with a minimum target of 20%+.
Thetausdt

THETA Token Perspective and Potential Gains - Cup & HandleTheta token seems to be creating a bottoming pattern , compressed into a Cup & Handle shape . I’m looking for a breakout above the $3.7 resistance level to confirm this bullish setup.
Currently, Theta is trading around $2.0 , which acts as a temporary support zone . However, it’s important to stay cautious — if the price drops below $1.5 , it could lead to a structure failure , invalidating this perspective.
Key Levels to Watch:
Cup & Handle Breakout Level: $3.7
Targets: $5 - $7 - $8 - $10
Let’s see how this plays out — breakouts from these patterns often gives great opportunities.

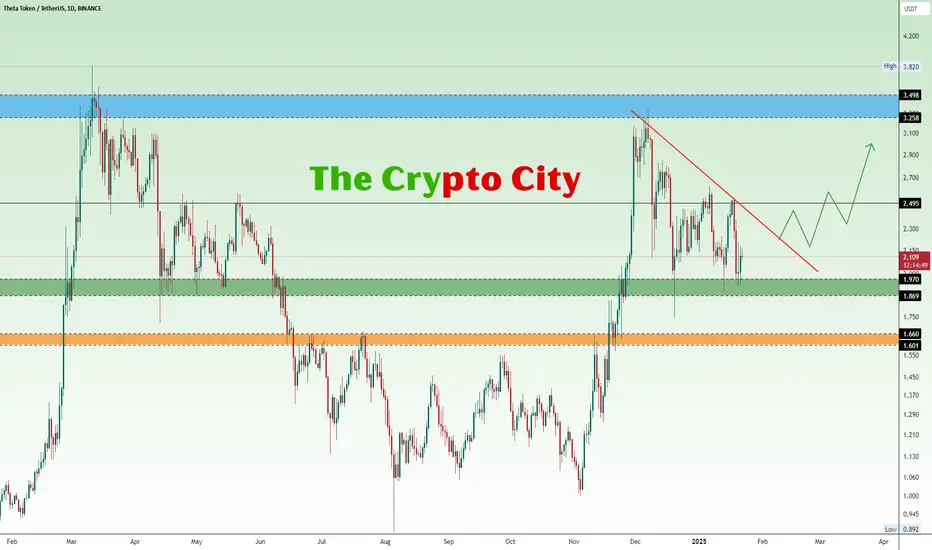
THETA Poised for a Major BreakoutTHETA is currently resting on a critical support zone (Green) at $1.869–$1.970, a level that has previously sparked significant bullish momentum. However, the price remains constrained by a descending trendline that has acted as stubborn resistance for weeks. The next move will be crucial in determining whether THETA continues its downtrend or reverses into a bullish rally.
If the Green support holds and the price breaks above the descending trendline, an upside move toward the $2.495 resistance level is likely. A break above this level could set the stage for a rally to the Blue resistance zone at $3.258–$3.498, especially if accompanied by strong volume and momentum.
On the downside, if the Green support fails, THETA could drop toward the Yellow support zone at $1.601–$1.660, where a pool of liquidity might trigger a bullish rebound.
THETA long term analysis updatei made an analysis on this coin weeks ago the main pattern is not changed these is a selling pressure on this coin when it touches the VWAP indicator but it made a perfect pattern for rising we have to wait for the last drop and after that the market will insanely rise !

theta long sell limit"🌟 Welcome to Golden Candle! 🌟
We're a team of 📈 passionate traders 📉 who love sharing our 🔍 technical analysis insights 🔎 with the TradingView community. 🌎
Our goal is to provide 💡 valuable perspectives 💡 on market trends and patterns, but 🚫 please note that our analyses are not intended as buy or sell recommendations. 🚫
Instead, they reflect our own 💭 personal attitudes and thoughts. 💭
Follow along and 📚 learn 📚 from our analyses! 📊💡"

THETAUSDT at a Crossroads: Breakout or Breakdown Ahead?Yello, Paradisers! Is THETAUSDT gearing up for a massive breakout or bracing for a sharp breakdown? Here's what you need to know right now.
💎#THETAUSD is currently sitting at a critical support level of $1.863 an area that has previously ignited significant bullish momentum. However, the price continues to struggle to break above the descending trendline, which has acted as a stubborn resistance for weeks. This makes the next move pivotal in determining whether we’re heading for a continuation of the downward trend or a reversal into a bullish rally.
💎If the bulls defend the $1.863 support zone and successfully break above the descending trendline, we could see an upside move toward the resistance zone at $2.60–$2.80. Beyond that, the next target sits at the resistance area of $3.48, which could trigger a substantial rally if supported by strong volume and momentum.
💎However, if the $1.863 support fails to hold, #THETANETWORK could slide toward the $1.570 demand zone, where there is a pool of liquidity that may prompt a bullish rebound. That said, a clean break below this demand zone would invalidate bullish scenarios, opening the door for further bearish pressure that could drive the price even lower.
Paradisers, stay sharp and disciplined! The market is brimming with both opportunities and risks, but only those who wait patiently for high-probability setups will thrive. Whether you’re leaning bullish or bearish, tight stop-losses and proper risk management are non-negotiable.
MyCryptoParadise
iFeel the success🌴

Massive Volume Spike This Blue Box Could Be the Game Changer!THETAUSDT: Massive Volume Spike—This Blue Box Could Be the Game Changer! 🚀
Ladies and gentlemen, we’re looking at a 229% daily volume spike . That’s big, really big. When you see numbers like this, you know there’s something brewing under the surface. The question is, are you ready to act?
Here’s the plan for THETAUSDT:
Blue Box Buy Zone: This is where the magic happens. It’s carefully identified as the area where buyers could step in aggressively.
Volume Surge Means Opportunity: A volume increase of this size doesn’t happen by accident. It’s a sign that the big players are getting involved, and we’re here to ride their wave.
Lower Timeframe Confirmation: I’ll wait for bullish market structure breaks on the 1H chart before entering. Tools like CDV, volume profile, and liquidity heatmaps will guide the final decision.
This is not just a trade—it’s a statement. The market doesn’t hand out opportunities like this every day. Take action, be decisive, and don’t let this slip by. Boost, comment, follow—and let’s crush it! 💥
Let me tell you, this is something special. These insights, these setups—they’re not just good; they’re game-changers. I've spent years refining my approach, and the results speak for themselves. People are always asking, "How do you spot these opportunities?" It’s simple: experience, clarity, and a focus on high-probability moves.
Want to know how I use heatmaps, cumulative volume delta, and volume footprint techniques to find demand zones with precision? I’m happy to share—just send me a message. No cost, no catch. I believe in helping people make smarter decisions.
Here are some of my recent analyses. Each one highlights key opportunities:
🚀 RENDERUSDT: Strategic Support Zones at the Blue Boxes +%45 Reaction
🎯 PUNDIXUSDT: Huge Opportunity | 250% Volume Spike - %60 Reaction Sniper Entry
🌐 CryptoMarkets TOTAL2: Support Zone
🚀 GMTUSDT: %35 FAST REJECTION FROM THE RED BOX
🎯 ZENUSDT.P: Patience & Profitability | %230 Reaction from the Sniper Entry
🐶 DOGEUSDT.P: Next Move
🎨 RENDERUSDT.P: Opportunity of the Month
💎 ETHUSDT.P: Where to Retrace
🟢 BNBUSDT.P: Potential Surge
📊 BTC Dominance: Reaction Zone
🌊 WAVESUSDT.P: Demand Zone Potential
🟣 UNIUSDT.P: Long-Term Trade
🔵 XRPUSDT.P: Entry Zones
🔗 LINKUSDT.P: Follow The River
📈 BTCUSDT.P: Two Key Demand Zones
🟩 POLUSDT: Bullish Momentum
🌟 PENDLEUSDT.P: Where Opportunity Meets Precision
🔥 BTCUSDT.P: Liquidation of Highly Leveraged Longs
🌊 SOLUSDT.P: SOL's Dip - Your Opportunity
🐸 1000PEPEUSDT.P: Prime Bounce Zone Unlocked
🚀 ETHUSDT.P: Set to Explode - Don't Miss This Game Changer
🤖 IQUSDT: Smart Plan
⚡️ PONDUSDT: A Trade Not Taken Is Better Than a Losing One
💼 STMXUSDT: 2 Buying Areas
🐢 TURBOUSDT: Buy Zones and Buyer Presence
🌍 ICPUSDT.P: Massive Upside Potential | Check the Trade Update For Seeing Results
🟠 IDEXUSDT: Spot Buy Area | %26 Profit if You Trade with MSB
📌 USUALUSDT: Buyers Are Active + %70 Profit in Total
🌟 FORTHUSDT: Sniper Entry +%26 Reaction
🐳 QKCUSDT: Sniper Entry +%57 Reaction
📊 BTC.D: Retest of Key Area Highly Likely
This list? It’s just a small piece of what I’ve been working on. There’s so much more. Go check my profile, see the results for yourself. My goal is simple: provide value and help you win. If you’ve got questions, I’ve got answers. Let’s get to work!

THETA Long Signal | 130% Profit Potential with 6.8 Risk-Reward✅ Key Trade Levels:
📌 Entry Point: $2.6
🛑 Stop Loss: $2.1
🎯 Take Profit: $6
📊 Analysis and Explanation:
The THETA chart shows a strong Harmonic Gartley pattern, where the price rebounded after touching the 61% retracement level of the XA wave. Additionally, an inverse head and shoulders pattern has formed, and the neckline has been broken decisively. The key resistance at $2.6 is the last barrier. Once this level is broken, a strong upward movement towards the $6 target is highly likely.

Trading opportunity for THETAUSDTBased on technical factors there is a Buy position in :
📊 THETAUSDT
🔵 Buy Now
🪫Stop loss 2.420
🔋Target 2.740
📏 R/R 2,2
💸RISK : 1%
We hope it is profitable for you ❤️
Please support our activity with your likes👍 and comments📝

theta usdt Update"🌟 Welcome to Golden Candle! 🌟
We're a team of 📈 passionate traders 📉 who love sharing our 🔍 technical analysis insights 🔎 with the TradingView community. 🌎
Our goal is to provide 💡 valuable perspectives 💡 on market trends and patterns, but 🚫 please note that our analyses are not intended as buy or sell recommendations. 🚫
Instead, they reflect our own 💭 personal attitudes and thoughts. 💭
Follow along and 📚 learn 📚 from our analyses! 📊💡"

THETA - A Nice Pattern for a quick tradeBINANCE:THETAUSDT (1D CHART) Technical Analysis Update
THETA is currently trading at $2.33 and showing overall bearish sentiment
Price got rejected from the resistance within the channel and expected to crash further. There is a good short trade opportunity here.
Entry level: $ 2.33
Stop Loss Level: $ 2.58
TakeProfit 1: $ 2.1
TakeProfit 2: $ 2.0
TakeProfit 3: $ 1.9
TakeProfit 4: $ 1.78
Max Leverage: 5x
Position Size: 1% of capital
Remember to set your stop loss.
Follow our TradingView account for more technical analysis updates. | Like, share, and comment your thoughts.
Cheers
GreenCrypto

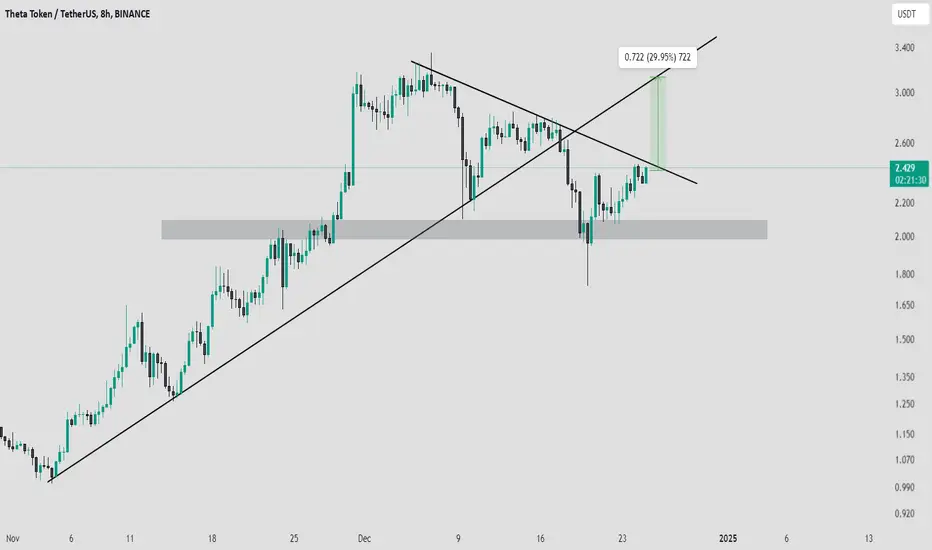
Breakout Watch: THETA Targets 30% RallyCurrently, THETA token is trading near the falling trendline resistance, and we anticipate a potential breakout above this level.
If the breakout occurs, the price could rally by over 30% from current levels. Additionally, the $2.00-$1.90 zone serves as a strong key support, providing a solid base for further upward momentum.
Keep an eye on this setup for confirmation!
DYOR, NFA
theta long midterm"🌟 Welcome to Golden Candle! 🌟
We're a team of 📈 passionate traders 📉 who love sharing our 🔍 technical analysis insights 🔎 with the TradingView community. 🌎
Our goal is to provide 💡 valuable perspectives 💡 on market trends and patterns, but 🚫 please note that our analyses are not intended as buy or sell recommendations. 🚫
Instead, they reflect our own 💭 personal attitudes and thoughts. 💭
Follow along and 📚 learn 📚 from our analyses! 📊💡"

theta midterm sell"🌟 Welcome to Golden Candle! 🌟
We're a team of 📈 passionate traders 📉 who love sharing our 🔍 technical analysis insights 🔎 with the TradingView community. 🌎
Our goal is to provide 💡 valuable perspectives 💡 on market trends and patterns, but 🚫 please note that our analyses are not intended as buy or sell recommendations. 🚫
Instead, they reflect our own 💭 personal attitudes and thoughts. 💭
Follow along and 📚 learn 📚 from our analyses! 📊💡"

THETAUSDT 1WTHETA Update ~ 1W
#THETA still in a strong bullish trend. If you still have Conviction on this coin,. Buy gradually within this support block,. with a minimum target of 20%++

TradeCityPro | Theta : Navigating Deep Corrections👋 Welcome to TradeCityPro!
In this analysis, I will examine Theta in both the weekly and daily timeframes, providing a detailed breakdown of its market dynamics and critical levels.
📅 Weekly Timeframe: Price Reaches Supply Zone Again
In the weekly timeframe, after forming a bottom structure around the $0.58 level, Theta initiated its first bullish wave, reaching the supply zone between $3.251 and $4.184 for the first time in this uptrend cycle.
🔍 Following the initial test of this resistance, the price corrected and established a higher low at $1.009, reinforcing its support. With the breakout above $1.654, the next bullish wave towards the supply zone began.
🚀 Currently, the price has been rejected from this supply zone with significant selling volume and has pulled back to $1.654. Sustained bullish momentum, characterized by sharp upward movements and dominant green candles, will require a breakout and consolidation above the supply zone.
✅ Upon clearing this resistance, Theta could rally towards the ATH at $12.978, with potential for further targets and a new ATH if $12.978 is surpassed.
🔽 A break below RSI 50 may lead to continued corrections, potentially revisiting $1.009. Despite this, as long as the price holds above $1.009, the market outlook remains bullish. Confirmation of a trend reversal would occur with a breakdown of this level, targeting the key $0.58 support, which remains a critical demand zone.
📈 RSI support at 50 and renewed buying volume could propel the price back towards the supply zone with stronger momentum.
📅 Daily Timeframe: Deep Correction in Progress
On the daily chart, the most recent bullish wave is visible in greater detail. Applying a Fibonacci Retracement, the price initially corrected to the 0.382 level, followed by a deeper correction after breaking the $2.257 low, extending to the 0.618 Fibonacci level.
📉 If the correction continues, the final retracement level, 0.786 Fibonacci, aligns with the $1.628 support, forming a Potential Reversal Zone (PRZ). A failure to hold $1.628 could see the price drop to $1.009, as noted in the weekly analysis.
Currently, bearish volume is increasing, signaling potential challenges for a bullish recovery in the short term.
🔼 A bullish breakout would require strong buying volume, but opening long positions near the supply zone carries significant risk. Instead, consider entering positions at lower levels where price action provides a clear trigger to reduce stress as the price approaches the supply zone.
📝 Final Thoughts
This analysis reflects our opinions and is not financial advice.
Share your thoughts in the comments, and don’t forget to share this analysis with your friends! ❤️ above.

THETAUSDT Analysis: Is the Bullish Momentum About to Fade?Yello, Paradisers! Are we witnessing a decisive move for THETA, or is the market setting us up for a breakdown? Let’s break it down.
💎THETA has shown a solid rebound upon touching its support zone, but the key lies in its next move. The 2.10 resistance level holds the deciding power. A daily close above this level would confirm a bullish continuation, potentially driving the price upward toward our target zones.
💎However, if THETA fails to reclaim 2.10, we could see a rejection that pulls the price back toward the 1.73–1.60 support area. Should this support hold, a rebound could occur, and we’ll be closely watching for a double bottom formation, which could signal a recovery.
💎The critical concern arises if the 1.73–1.60 support zone fails to hold. This area coincides with the support trendline, so a breakdown here would be a bearish signal, potentially driving the price downward toward the demand area.
💎Now, the demand zone near 1.16 is a vital level for THETA to maintain any bullish prospects. Historical rebounds in this zone are limited, so its importance cannot be overstated. A close below 1.16 would invalidate the bullish thesis and confirm a bearish trend.
Stay focused, trade smart, and remember—it's the disciplined traders who win the long game.
MyCryptoParadise
iFeel the success🌴

THETA Long OpportunityMarket Context:
Several altcoins, including THETA, have retraced to their horizontal support levels, presenting a prime opportunity for a long position with favorable risk-to-reward.
Trade Details:
Entry Zone: Between $1.99 – $2.14
Take Profit Targets:
$3.10 – $3.35
$4.00 – $4.40
Stop Loss: Just below $1.70
This setup leverages THETA’s strong support level, providing clear upside potential while managing risk effectively. 📈

theta sell midterm"🌟 Welcome to Golden Candle! 🌟
We're a team of 📈 passionate traders 📉 who love sharing our 🔍 technical analysis insights 🔎 with the TradingView community. 🌎
Our goal is to provide 💡 valuable perspectives 💡 on market trends and patterns, but 🚫 please note that our analyses are not intended as buy or sell recommendations. 🚫
Instead, they reflect our own 💭 personal attitudes and thoughts. 💭
Follow along and 📚 learn 📚 from our analyses! 📊💡"

TradeCityPro | THETAUSDT Has the Market Turned Bearish?👋 Welcome to TradeCityPro Channel!
Let’s analyze a day when the market experienced slight corrections, with some coins recording red candles and traders feeling FOMO, moving away from the market. This is the best time to review triggers.
🌟 Bitcoin Overview
As always, let’s start with Bitcoin analysis. In the one-hour timeframe, we are witnessing bearish candles, which are merely rejections of the new ATH. Such corrections are not concerning as they come with reduced volume.
Bitcoin dominance has also been ranging, causing slight corrections across all altcoins. Coins bearish in their Bitcoin pairs have seen more significant declines, while those bullish in their Bitcoin pairs are showing better resilience.
📅 Weekly Timeframe
In the weekly timeframe, THETA is one of the coins that previously had a strong movement. Earlier in 2024, it hit a new high compared to 2023, bouncing back from the 1.028 support level, which gives it a better edge than many other coins.
Recently, after breaking the 1.667 resistance, which was our entry trigger, it has reached the early 2024 resistance level and is now reacting to it. Following the correction and red candles, the declining volume indicates a positive sign for the upward trend.
The RSI is pulling back toward the overbought zone. If the RSI climbs back up from this level, we can anticipate another sharp move.
If you entered with our trigger, it’s reasonable to hold your position for now as you have a solid entry point. For those looking to enter again, either wait for a correction or buy after breaking the 3.136 level with a large stop loss at 1.667. However, this would be a riskier entry.
🌞 Daily Timeframe
In the daily timeframe, after breaking out of the accumulation box between 1.543 and 3.136, THETA has experienced a 100% upward movement, providing an excellent profit opportunity.
Throughout this uptrend, we’ve seen an increase in volume, which has subsequently decreased during corrections. Even when red candles appear, the reduction in volume is a positive signal for the coin’s long-term trajectory.
Based on Fibonacci levels, potential supports are at 2.349, 2.011, and 1.543. After confirmation at any of these levels, long positions can be entered. For continued momentum, breaking the 3.136 level with a stop loss at 2.349 can be considered a riskier option.
⏰ 4-Hour Timeframe
In the four-hour timeframe, the coin is moving within a short-term box between 2.534 and 2.749, accompanied by reduced volume and consolidation. This suggests that a breakout is likely soon.
📈 Long Position Trigger
breaking the 2.749 level could trigger a trade, as the 3.136 breakout is expected to be led by whales. However, if you miss the 2.749 breakout, 3.136 can also serve as an entry.
📉 Short Position Trigger
they are not currently recommended. However, a break below the 2.534 level could offer a risky short setup. Ensure small stop losses and quick profit-taking, as extended downside seems unlikely.
💡 BTC Pair Insight
In the Bitcoin pair, THETA is just starting to show strength. It has recently reached its weekly resistance level and has a long way to go before its ATH. Once it establishes a higher low and breaks the 0.00003042 resistance, it could begin a strong upward movement. Stay patient and avoid FOMO if you’ve missed this move. Many other coins in the channel have not yet triggered their entries.
📝 Final Thoughts
Stay calm, trade wisely, and let's capture the market's best opportunities!
This analysis reflects our opinions and is not financial advice.
Share your thoughts in the comments, and don’t forget to share this analysis with your friends! ❤️

$THETA On MidtermTHETA on weekly on top and had to correction
you can buy at bullish trendline
notice that we have in weekly time frame and take time to get near the trendlne

THETA is on its way to being a Tier-2 projectTheta is a rather large project in terms of capitalization and it is quite difficult to move its price. From the chart point of view everything looks bullish and is about to shoot. You could also draw a cup with a pen here, but I didn't want to clutter the chart. Fairly good buyback reaction this week, the RSI is in the overbought zone and I think the asset's potential is not as high as a number of altcoins. This is not a bad option for investors who take a conservative approach to the market and for traders who like to trade with high leverage.
Horban Brothers.

Is THETAUSDT on the Verge of a strong bullish move?Yello, Paradisers! Are you ready to catch a potential surge in THETAUSDT? We’ve got our eyes on this one, and it’s time you should too!
💎 #THETAUSDT has successfully broken out of a descending channel. Now, we’re expecting a retest of the descending resistance. If the price completes this retest phase, it could pave the way for a bullish move from the demand zone around $1.231.
💎But what if momentum stalls and the price of #thetausd drops below this demand zone? Don’t worry; we’ve planned for that too. In such a case, we’re looking at a potential bullish rebound from the lower support zone at $0.902. This support is crucial due to its historical price action, and if the pattern holds, we anticipate a strong bullish move toward the next significant resistance level.
💎 However, if the price breaks below this support, it would invalidate the bullish setup and could lead to a significant drop.
As always, employ prudent trading strategies and ensure you have proper stop-loss measures in place. Stay vigilant to market movements, and we’ll keep you updated with more insights.
MyCryptoParadise
iFeel the success🌴
