THETA 240 TF CHARTTHETA is breaking a bullish accumulation zone. The price is compressing leaving more compact highs and lows, which is a clear sign of price continuation. We are looking for a price target at least in the same range as the previous impulse.
Thetausdt


THETAUSDT H16: THE BEST Level to BUY/HOLD 100%+ gains(UPDATED)Why get subbed to me on Tradingview?
-TOP author on TradingView
-15+ years experience in markets
-Professional chart break downs
-Supply/Demand Zones
-TD9 counts / combo review
-Key S/R levels
-No junk on my charts
-Frequent updates
-Covering FX/crypto/US stocks
-24/7 uptime so constant updates
THETAUSDT H16: THE BEST Level to BUY/HOLD 100%+ gains(SL/TP)(UPDATED)
IMPORTANT NOTE: speculative setup. do your own
due dill. use STOP LOSS. don't overleverage.
🔸 Summary and potential trade setup
::: THETAUSDT H16 chart review
::: chart looks good /strong
::: setup still valid as of right now
::: still expecting pullback off the highs
::: get ready to BUY LOW later
::: accumulation in range previously
::: then we had 150% gains PUMP
::: we had 2 pump already before this
::: 265% pump - pullback
::: then 150% pump and now pullback mode
::: expecting short-term pullback
::: BULLS get ready to BUY after pullback
::: TP bulls is +100% gains later
::: expecting decent gains soon
::: 20-30% pullback short-term
::: recommended strategy: BUY/HOLD after pullback
::: TP BULLS +100% gains
::: SWING TRADE: BUY/HOLD IT
::: bull run not over yet
::: good luck traders!
::: BUY/HOLD and get paid. period.
🔸 Supply/Demand Zones
::: N/A
::: N/A
🔸 Other noteworthy technicals/fundies
::: TD9 /Combo update: N/A
::: Sentiment mid-term: BULLS
::: Sentiment short-term: BEARS/PULLBACK
RISK DISCLAIMER:
Trading Crypto, Futures , Forex, CFDs and Stocks involves a risk of loss.
Please consider carefully if such trading is appropriate for you.
Past performance is not indicative of future results.
Always limit your leverage and use tight stop loss.

Theta Network (THETA) - Februray 18Hello?
Dear traders, nice to meet you.
"Like" is a huge force for me.
By "following" you can always get new information quickly.
Thank you for always supporting me.
-------------------------------------------------- -----
We have to see if we can get support and climb at 3.5255.
In particular, it remains to be seen if it can rise along the uptrend line (4).
If it falls, you need to make sure you get support at 3.3840.
If you fall from the 3.3840 point, you can touch the 3.1011 point, so you need to trade carefully.
If you decline at 3.1011, you need a short stop loss.
If it deviates from the uptrend line (4), there is a possibility of a price adjustment to touch the uptrend line (3).
Accordingly, the expected support range is between 2.6766-2.8181.
-------------------------------------------------- -------------------------------------------
** All indicators are lagging indicators.
So, it's important to be aware that the indicator moves accordingly with the movement of price and volume.
Just for convenience, we are talking upside down for interpretation of the indicators.
** The wRSI_SR indicator is an indicator created by adding settings and options from the existing Stochastic RSI indicator.
Hence, the interpretation is the same as the conventional Stochastic RSI indicator. (K, D line -> R, S line)
** The OBV indicator was re-created by applying a formula from the DepthHouse Trading indicator, an indicator that oh92 disclosed. (Thank you for this.)
** Check support, resistance, and abbreviation points.
** Support or resistance is based on the closing price of the 1D chart.
** All explanations are for reference only and do not guarantee profit or loss on investment.
Explanation of abbreviations displayed on the chart
R: A point or section of resistance that requires a response to preserve profits
S-L: Stop Loss point or section
S: A point or segment that can be bought for profit generation as a support point or segment
(Short-term Stop Loss can be said to be a point where profits or losses can be preserved or additionally entered through installment transactions. It is a short-term investment perspective.)
GAP refers to the difference in prices that occurred when the stock market, CME, and BAKKT exchanges were closed because they do not trade 24 hours a day.
G1: Closed price
G2: Market price at the time of opening
(Example) Gap (G1-G2)

THETAUSDT H16: THE BEST Level to BUY/HOLD 100%+ gains(SL/TP)(NEWWhy get subbed to me on Tradingview?
-TOP author on TradingView
-15+ years experience in markets
-Professional chart break downs
-Supply/Demand Zones
-TD9 counts / combo review
-Key S/R levels
-No junk on my charts
-Frequent updates
-Covering FX/crypto/US stocks
-24/7 uptime so constant updates
THETAUSDT H16: THE BEST Level to BUY/HOLD 100%+ gains(SL/TP)(NEW)
IMPORTANT NOTE: speculative setup. do your own
due dill. use STOP LOSS. don't overleverage.
🔸 Summary and potential trade setup
::: THETAUSDT H16 chart review
::: chart looks good /strong
::: accumulation in range previously
::: then we had 150% gains PUMP
::: we had 2 pump already before this
::: 265% pump - pullback
::: then 150% pump and now pullback mode
::: expecting short-term pullback
::: BULLS get ready to BUY after pullback
::: TP bulls is +100% gains later
::: expecting decent gains soon
::: 20-30% pullback short-term
::: recommended strategy: BUY/HOLD after pullback
::: TP BULLS +100% gains
::: SWING TRADE: BUY/HOLD IT
::: bull run not over yet
::: good luck traders!
::: BUY/HOLD and get paid. period.
🔸 Supply/Demand Zones
::: N/A
::: N/A
🔸 Other noteworthy technicals/fundies
::: TD9 /Combo update: N/A
::: Sentiment mid-term: BULLS
::: Sentiment short-term: BEARS/PULLBACK

THETA Buy and Sell Signal forecast on 3 timeframesIf you haven`t bought it here:
Now even though THETA is bullish on higher timeframes, it gets sell signals on lower ones.
Sell on 1 hour chart
Sell on 4h chart
Buy on 1 day chart
If you are interested to test some amazing BUY and SELL INDICATORS, which give the signal at the beginning of the candle, not at the end of it, just leave me a message.

$THETAUSD - Tw major resistances are being testedHello everyone!
THETAUSD is testing important resistances at this moment.
Most likely that the pair will breakout from the resistance, though before doing so it will correct a bit.
Nevertheless, going long above 2.60 up to 3.00 and 3.30 is a good idea, if the pair corrects, then see the best nearest support and go long up to 2.80 for the start and to 3.30 if above 2.80.


Theta Breakout Setup | Triangle breakoutTheta Cryptocurrency token price now in Triangle and ready to break above the triangle buy once price close above the 0.0000760
Theta bitcoin pairs looks absolutely bullish can breakout big above the 7600 sats zone
let's check the line chart
In line chart of the theta / bitcoin we have are touching big resistance breakout above this resistance will send price higher.
Buy : above 7600 sats
Stop loss : 5500 sats
Target : 9000 , 11000 , 13000 , 14800 sats

THETAUSDTOne for the watch list.
I have not enterted a trade with Theta Token, however i am liking the respect price has been giving to my trendlines with multiple touches and pullbacks.
Price has finally broken the upper channel from January 3rd however bearish divergence on the squeeze indicator along with the 121.2% fibb extension from the latest A-B-C move may indicate a retracement back to the $3.10-$3.20USDT zone.
Waiting for a break and close of $3.50USDT before looking to enter a trade.

THETA BULISH MOVE TO $6Hello Traders,,
The chart is telling me THETA is bullish. I have a price target of $6-$6.50
Will update as this unfolds.


THETA/USDEnter limit long 2,60000
SL 2,40000
PT 3,0000
BE 2,8000
RRR 2,25:1
mid term
BINANCE:THETAUSDT

10$ Theta - Blockchain based version of YouTubeTheta is looking super bullish with super strong fundamentals. look to get an entry in the above buy zones.
Guys please our other channel "https://www.tradingview.com/u/profittraders23/", we post more trades there.

Price projection in THETA 4H is respecting! Optimistic scenarioTechnical analysis regarding the price of THETA in relation of dollar Tether for the next scenarios, based on 1 hour movement.
disclaimer
*** In accordance with CVM Instruction No. 598, of May 3, 2018, Art. 21, I declare that the recommendations of this analysis reflect solely and exclusively my personal opinions and perceptions and that they were prepared independently and autonomously. Not being considered a purchase and/or sale recommendation. ***


THETA BACK IN THE CHANNELBased on what has been seen, thnx to plancton0618 analysis, Theta appears to break a down trend triangle, just to follow inside the up trend channel, There's some heavy resistance at $2.50; after that could reach from $3.20 to the $6.29 mark, it may had a similar growth trend as UNIUSDT.
Just keep an eye an set some alert.
-I'm not a financial advisor, your decisions is you own responsibility.
------------------------------------------------------------------------------------
Basado en lo que se ha visto, gracias al análisis de plancton0618, Theta parece romper un triángulo de tendencia bajista, solo para seguir dentro del canal de tendencia alcista. Hay una fuerte resistencia a $ 2.50; después de eso podría llegar desde $ 3,20 a la marca de $ 6,20, puede tener una tendencia de crecimiento similar a UNIUSDT.
Solo mantén un ojo y establece alguna alerta.
-No soy un asesor financiero, sus decisiones son de su responsabilidad.

THETA will resume its up trend as long as 2.39 will holdTHETA will resume its up trend as long as 2.39 will hold 4.4 would be the first target

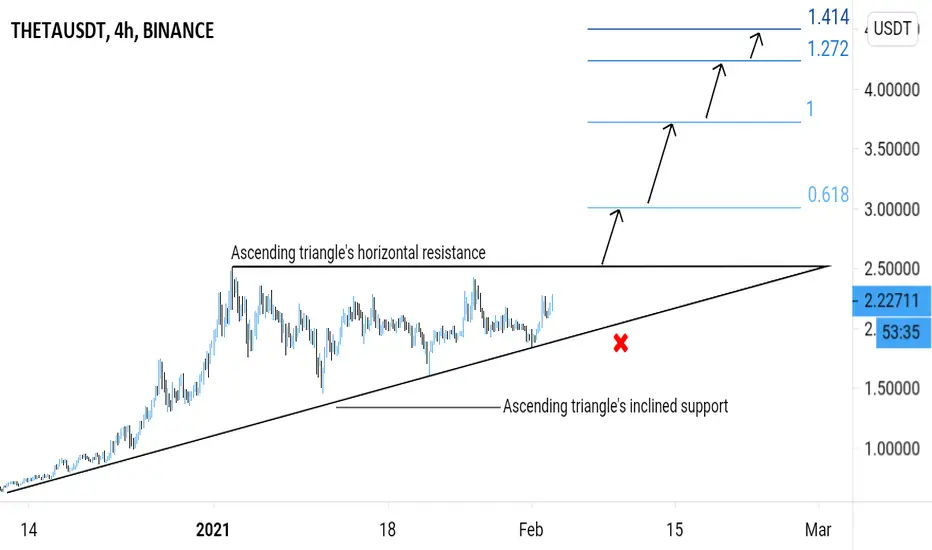
THETAUSDT (THETA TOKEN) - IMMINENT BREAKOUT ANALYSIS 🔎
- THETAUSDT is building up in an ascending triangle pattern.
- This is a bullish build up pattern.
- There's an upward breakout potential.
BUY ENTRY ⬆️
- Breakout above the ascending triangle's horizontal resistance.
TARGETS 🎯
- Fibonacci extension levels.
SETUP INVALIDATION ❌
- Breakdown below the ascending triangle's inclined support.
THETAUSDT (THETA TOKEN) - UPTREND CONTINUATION ANALYSIS 🔎
- THETAUSDT is testing the ascending channel support.
- Price action is printing a symmetrical triangle pattern.
- This is a bullish pennant continuation pattern.
- There's a breakout potential.
BUY ENTRY ⬆️
- Breakout above the symmetrical triangle's inclined resistance.
TARGETS🎯
- Previous swing high horizontal resistance (R1).
- Fibonacci extension levels
- Ascending channel resistance.
SETUP INVALIDATION ❌
- Breakdown below the ascending channel support and symmetrical triangle's inclined support.

Theta Has Reached The End Of Bull Flag For Big MoveHey friends, hope you are well, and welcome to the new update on Theta coin.
A powerful rally and sideways move:
After the powerful rally, the price action of Theta is moving sideways since 2nd Jan 2021. 1st it was moving in the parallel channel but after forming higher lows and lower highs the pattern has been changed to a symmetrical triangle. And this move has also formed a bull flag on the daily time period chart as well.
The EMAs:
On the daily time frame chart, the price action is also using exponential moving averages with the time period of 10 and 21 again and again. This time the priceline has again bounced by the EMA 21 and reached the resistance of the triangle.
The volume:
We have a powerful buying volume in the end of Dec 2020 then 1st week of Jan and the last week of Jan 2021. With volume, the volume oscillator was also giving powerful buying volume signals. Now the volume is being decreased. Now there is a possibility that again the volume oscillator will rise up and if this volume oscillation will be for buyers then the priceline may breakout the resistance of the triangle.
Conclusion:
As the priceline of Theta has reached the end of the triangle and bull flag, therefore, there are more chances that soon this sideways trend will be over.

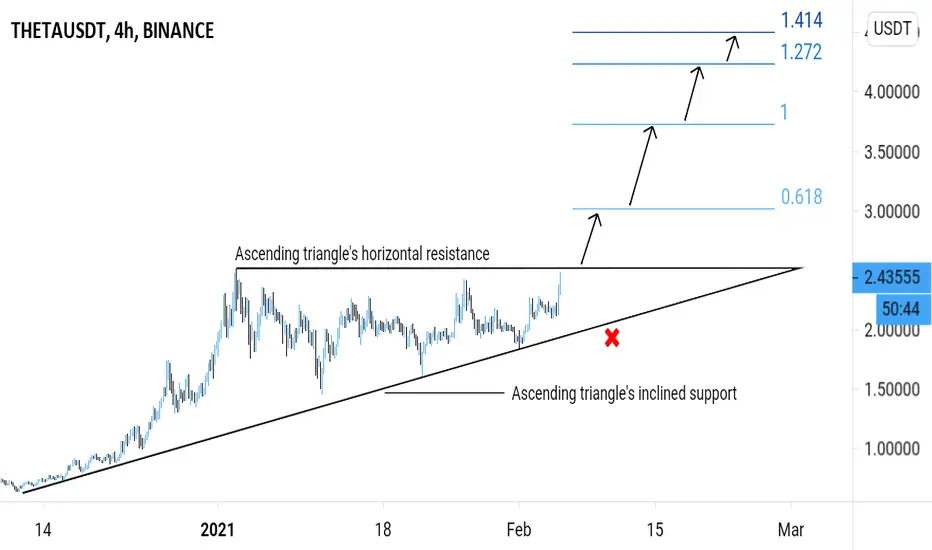
THETAUSDT (THETA TOKEN) - POTENTIAL BREAKOUT ANALYSIS 🔎
- THETAUSDT is building up in an ascending triangle pattern.
- This is a bullish build up pattern.
- There's an upward breakout potential.
BUY ENTRY ⬆️
- Breakout above the ascending triangle's horizontal resistance.
TARGETS 🎯
- Fibonacci extension levels.
SETUP INVALIDATION ❌
- Breakdown below the ascending triangle's inclined support.