THETAUSDT - 2 TARGET +129.6% ROE 20xThey reached the long-awaited targets.
He stopped at the entrance
Once again, I congratulate everyone who reads my reviews. More information in the profile description
THETAUSDT - OPTIMAL ENTRY POINT FOR A LONG POSITION
THETAUSDT - ENTRY
Thetausdt

THETAUSDT is getting ready to go burstThis 2W chart reveals many interesting things.
Price action has been boring but very telling: the 1$ mark has been rock solid for the past 6 months. If we're indeed at the end of an ABC correction on the 5th Elliot Wave, then 3 important crosses are bound to happen for a new bullrun to start:
RSI cross with its MA
MACD cross with its signal. The last cross on June of 2021 sentenced the beginning of the corrective phase. I assume that the opposite cross must indicate the opposite scenario
Breakthrough of the 1.5$ and resistance. This would be a good entry point, for that would increase significantly the chances of the trendline breakthrough.
The volume is low but in my opinion, that has more to do with the 1$ resilience which I think prevented capitulation and with the fact that price has been steadily dropping since its last ATH. With that being said, I expect a new ATH to be reached in the next bull market within the 1.618 and 2.618 extensions, being 25$ the first target.
Let's wait and see, but it definitely looks promising.
DYOR. Not advice

THETAUSDT - OPTIMAL ENTRY POINT FOR A LONG POSITIONIt looks great, there is a good zone of interest, the entrance is either from 0.5 fvg, or from the zone of interest with a broken structure.
Do not forget that the enrty was only after confirmation. That is - holding the price, volume and LFT confirmation.
The targets will be liquidity withdrawal marks indicated on the trading chart.
It all depends on your trading style, leverage and the amount of margin in the position.


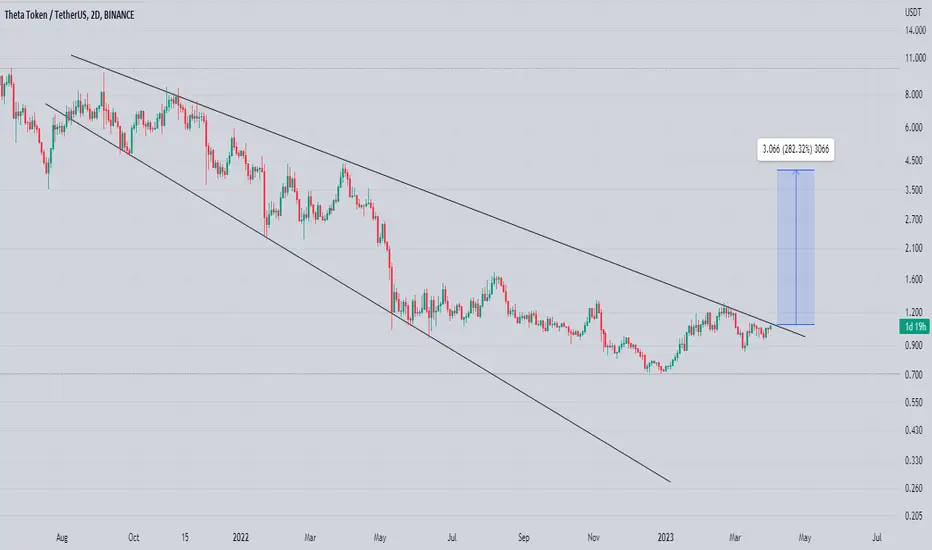
Theta Getting Ready To clear Downtrend Resistance Seems Like Bottomed Out And Building Up For Massive Breakout
Formed Descending Broadening Wedge Incase Of breakout Expecting 250 to 280% bullish Move

THETAUSDT 2H HR STIf you check THETA's parity with Bitcoin, you will see that it is gaining strength compared to Bitcoin, this promises an upward movement.

Tfuel On verge Of Massive Breakout Seems Like Has already Bottomed Out
Formed Descending Channel 2Day Timeframe Incase Of Breakout Expecting 240 - 260% Bullish Move
Note Always wait for Confirmed breakout

THETA good to buyTheta is setting up a buy point and bullish triangle nice pattern for the uptrend, a bullish channel will be set up with a 161% upside target extending from the current wave's nice correction. Follow us to update new charts and comment the chart you want to analyze

Theta coin forming BAT for upto 10% moveHi dear friends, hope you are well and welcome to the new trade setup of Theta coin with US Dollar pair.
Previously I shared a long-term trade setup for THETA, which is still in play as below:
Now on a 4-hr time frame, THETA is about to complete a bullish BAT move for bullish price reversal.
Note: Above idea is for educational purpose only. It is advised to diversify and strictly follow the stop loss, and don't get stuck with trade

Theta Bullish scenario Long termthis is my bullish scenario for theta in the long term. targets are provided and resistance lines.

THETA/BTC Bullish scenarioTHETA/BTC looking like it can have a breakout to the upside. The symmetrical triangle can hit either direction but with the correct news and updates we could see an uptrend.

Ichimoku Analysis for THETA1) Kumo Crossover
2) Price closing below kumo cloud.
At least 10% #profit on cards with the short.

THETA/USDT Structure analysisDetermine the structure of the market and then enter the trade on the lower time frames

THETAUSDT IdeaTHETAUSDT THETAUSD
✅ ✅ Risk warning, disclaimer: the above is a personal market judgment and analysis based on published information and historical chart data on The trading view,
And only some of these analyzes are my actual real trades.
I hope Traders consider I am Not responsible for your trades and investment decision.

THETA is currently in a consolidation phaseTHETA is currently in a consolidation phase and trading within a range. The major support zone is between $1.140 - $1.15, and the significant resistance is $1.300 - $1.310. One can use range trading with proper stop-loss until there is no aggressive move from Bitcoin. Additionally, a triangle pattern formation could lead to a setup, so keeping an eye on a breakout is advisable.

Tfuel On verge Of Massive Breakout Seems Like Tfuel Has Already Bottomed Out
Overall Moving In Descending Broadening Wedge In Higher timeframes
Now Testing Trendline Incase Of breakout Expecting Major trendline Test & If Major Trendline Broken Too Then Our Midterm Target Will Be In between 0.25 to 0.30

THETA perspectiveHi, guys.
Today, I'm going to share THETA's perspective.
THETA is creating an rising channel after ending its 1w decline channel.
If the candle touches and supports the bottom of the rising channel and the 1w order block, the probability of rising is high.


THETA IS BULLISHHi, dear traders. how are you ? Today we have a viewpoint to BUY/LONG the THETA symbol.
For risk management, please don't forget stop loss and capital management
When we reach the first target, save some profit and then change the stop to entry
Comment if you have any questions
Thank You

ETH/USD 1DAY UPDATE BY CRYPTO SANDERS !!Hello, welcome to this ETHEREUM /USD update by CRYPTO SANDERS.
CHART ANALYSIS:-Ethereum (ETH) also made considerable gains today, with prices rising to as high as $1,700.
ETH/USD hit a high of $1,700.85 earlier in the day, less than 24 hours after trading at the bottom of $1,572.99.
As a result of this move, ethereum climbed to a two-week high, following a move beyond a ceiling of $1,675.
Since this peak, earlier gains have somewhat eased, as the RSI has collided with a hurdle at the 63.00 level.
At the time of writing, price strength is hovering at 61.61, which is marginally below the aforementioned ceiling.
Should this wall break, bulls could attempt to make further runs deeper into the $1,700 region.
I have tried to bring the best possible outcome to this chart.
Hit the like button if you like it and share your charts in the comments section.
Thank you

Theta Idea | THETAUSDT SignalTHETAUSD | THETAUSDT
✅ ✅ Risk warning, disclaimer: the above is a personal market judgment and analysis based on published information and historical chart data on The trading view,
And only some of these analyzes are my actual real trades.
I hope Traders consider I am Not responsible for your trades and investment decision.
