Remarkable dropThe nice demand zone mitigation aggressively hiked price to level 1.35679 while creating significant areas in between. Acknowledged e remarkable drop which slightly respected the fair value gap, made a minor contraction and persistently dropped to spike the inducement and simultaneously respected the imbalance. The market started to ascend and created three drives to push to the upside and made equal highs. With is equal highs drop, the anticipation is for price to mitigate the nearest demand zone and go bull to the supply zone. The supply zone shall active sellers and gives us a swift bearish market to levels 1.34158 and 1.34042. However, this beautiful setup has an alternative as well…
Three Drives

Evolving with the pairCurrently within a 4h bullish channel. Thus far the market has made two drive and the wait is on the ultimate third touch to give us three drives, however, we have a 4h order block at 86.200. Should this order block be respected, the price will be delayed to give us the anticipated third touch. If this current price goes up a bit to mitigate the supply zone, then the market is more like to drop below this order block and give us the ultimate third drive…

IDX:ERAA Three Drive Pattern and Double BottomENGLISH:
By paying attention to the consistency of the IDX:ERAA market movement, it can be predicted by using a descending parallel channel and three repeating patterns, the ERAA market will bounce to 525-540. If there is a daily market opening above 540 then there is a high probability that IDX:ERAA will break free from the bearish trap and return to bullish.
However, by looking at the current conditions there is still no certainty, the main bearish target is the formation of a double bottom between 410-382
BAHASA:
Dengan memperhatikan konsistensi pergerakan pasar IDX:ERAA dapat diprediksi dengan menggunakan paralel channel menurun dan tiga pola mengulang, Pasar ERAA akan mantul ke 525-540. Jika ada pembukaan pasar harian diatas 540 maka besar kemungkinan IDX:ERAA akan terlepas dari jerat bearish dan kembali bulish.
Namun dengan melihat kondisi saat ini masih belum ada kepastian, maka target bearish utama adalah terbentuknya double bottom antara 410-382

BTCUSDT 1D Shoulder Head is almost doneBitcoin are performing Shoulder Head Shoulder and almost completed. The target will be on Red box and maximum pain will be to yellow box.
The other technical analysis are descending parallel channel and three drive pattern. They are point the same target about the dump, which is 26K and next target will be 23K-22K

Emerging bullish order flowThe market has been consolidating and creating more corrective move compared to impulsive moves which led us to a demand zone that was in alignment with three bullish drives. The combination hiked price up to the initial internal liquidity level after breaking the structure. On lower timeframes we spot a nice contraction which provides a distribution phase, a drop is expected from here, should price break below the fair value gap, then we look for bullish entries on the breaker block and we target 0.62261 because this looks like a bullish order flow under construction…

Perfect automated detection of 3Drive pattern - ShortA bearish-type 3Drive pattern occurred near the resistance zone of 1.8010-1.8310.
(In this resistance zone , there was a rebound in Aug 2020, May 2020)
Short after seeing the rebound.
*Harmonic patterns and support/resistance zones are automatically detected using the indicators below.
- Harmonic auto-detect PRO
- Support/Resistance Zone Auto PRO

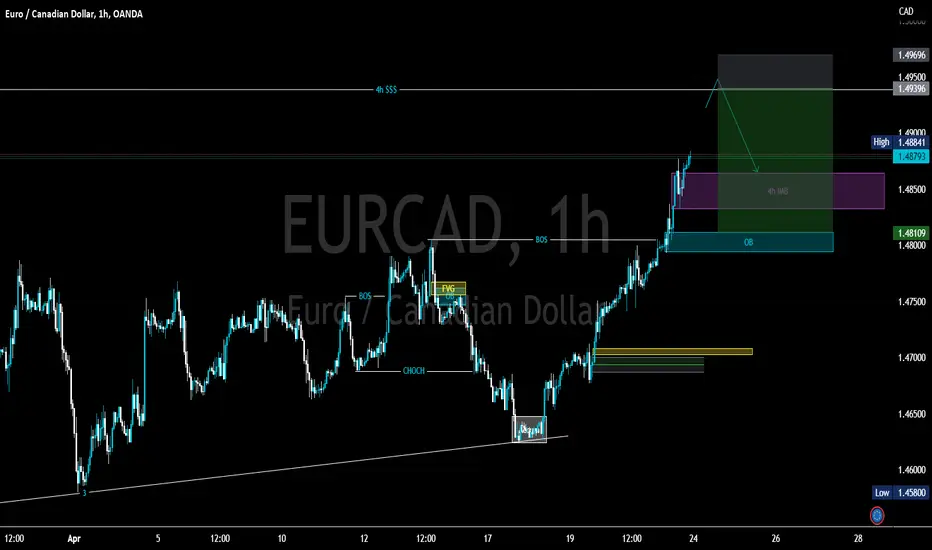
4h timeframe is the priorityThe market printed a stunning three drives pattern in which the third drive went volatile on the 4h timeframe and broke out of the internal liquidity level. With the idea that price follows liquidity, the anticipation is for price to push to level 1.49388 which is the 4h liquidity pool. From the high we’re looking for a liquidity sweep to drive the market down to the significant areas below…
Should the area get some respectThe 4h time frame is looking clearer, price is going up -we have a bullish order flow. Currently we have price approaching the fair value gap, if price doesn’t persist with this upward move and should the area act as a rejection then we ought to look for that third touch to give us three bullish drives to the upside. Then we’ll have a sell to buy market scenario. The main priority is the bullish one and the target is the imbalance above…

Invalidated drivesThis structure looks quite interesting, as we follow its data we acknowledge that the three drives pattern was invalidated, price made a pullback to both the order block and fair value back then reduced and broke through… Price then broke below, and swept this minor internal liquidity that resonates with the internal demand zone… so from here I’m anticipating a pullback to the highlighted OB then swiftly go bearish to level 1.45800…

Channelled inPrice made a liquidity sweep in a corrective nature and made an inverse shooting star to drive the market all the way down and created divergence. The complete creation pushed up and respected the area by a wick we boosted the current pullback with some momentum. With this move in motion, the hunch is for price to mitigate this instant order block then go bullish to the supply zone…

Correction Ray Range for GoldGold is a truly different things with other investing objects.
After reach highest high this year, we can see how much fear and fragile ranging price above 2k.
Nowadays people realize more that somehow they can make a good investment on gold, but in the other side gold is not a thing that can used as money machine. They can have the expected benefit from gold after they loose that thing.
So then, let’s see how fast gold can move closer near to it’s fair value after FOMO happened on bank rush insident.
One thing that has same power with FOMO is FATT (Fear At The Top)

Volatility contraction1.22741 which happens to be the first drive, drove price up to give us a liquidity pool which also gave sellers the takeover to correct the inefficiency and to provide the second drive. The second drive advanced in a volatility contraction pattern, the contraction created a swing high high which the got broken by the volatile move. Then eventually a liquidity sweep took place, the market created a small distribution phase to drive price to the demand region. Now price looks to have respected the zone and simultaneously provided a third drive to complete the three drives. This gives us the idea of a young bullish move to make a pullback to the fair value gap, this pullback is expected to reject price to the demand zone…

Liquidity piercingThe shooting star candlestick made a huge liquidity piercing and dragged the price down to mitigate the inner demand zone which pushed made a contraction that respected the breaker. The breaker block led price to decline even more to break the structure and create divergence. The divergence pushed up and mitigated the supply zone to give us the stunning opportunity to sell all the way to both 1h and 4h liquidity pools. After the 1h liquidity sweep, price made a short pullback to wick that got broken and continued to go bearish to hit the target. Price pierced the 4h liquidity pool way too much than expected, but we still have a possibility of going bullish because we have more like a falling wedge and price just made a third touch to complete the three drives pattern, we have a doji candlestick as the current one, this good be the strong beginning of a bullish market…

60k July forecast - and the end of Bitcoin Cycles is coming.The Bitcoin cycles get really repetitive once you layout the movements like I have here we start to see the patterns it creates.
I don't daily trade I don't recommend you to either, open your mind to a further time frame and setup prior to these movements giving you freedom to use lower leverage if you do trade.
I use the L-MACD (Logarithmic Moving Average Convergence/Divergence) with a simple trend line plotted at .20 points, what we can notice here with the momentum oscillator below 0.20 points is where Bitcoin trends for a good amount of months before making a fast rapid return to the average of the 0.20 trend line. A return the trend line repeating historic movements would put Bitcoin at around $60,000 by July-Aug 2023. Note the future bar lines are to be used for total days of movement prior to a bull market not the dollar values.
Where I positioned the red pin is where we should expect a red X to occur with momentum shifting from bearish to neutral, neutral then to bullish.
What people really forget about previous cycles is the 1/2 years prior to the peak of the market a very strong accumulation occurs, its happening right now. Don't be misguided by the second peak in the market it is irrelevant to the overall growth and movement of Bitcoin, every cycle has its theme and painting of a different picture but ultimately resulting in the same movement and growth into the next cycle.
When we return to $60,000 by July-Aug what would the high be in 2025-2026? lets take a look at previous psychology
-----------------------------
2011 $2.17
x570
2013 $1,240
-----------------------------
2015 $164
x120
2017 $19,770
-----------------------------
2020 $3,800
x18
2021 $69,000
-----------------------------
2022 $15,000
x72
2025 ? ($1,080,000)
-----------------------------
Elephant in the room, end of cycles is it coming? sadly yes. I hope we all can see the world past 2040 where "Bitcoin Cycles" will be seen as a period where this all started, kids of the future will wish they was around to see this unfolding in real time, some of course will think they could have made fortunes from it. Although Bitcoin Cycles will end, bull & bear markets will not.
Eventually Bitcoin will be worth $25,000,000 a single coin a lot compared to today's value right? but even a 1x of the future puts $25,000,000 to $50,000,000 that will be the new growth over decades.
The period where large financial institutions and wealthy sovereign states make the leap of allocating and becoming a holder of Bitcoin is where we will likely see a gigantic move unlike any other previously, this allocation once regulation is fully in place will shoot Bitcoins price beyond your imagination, this will sadly mark the end of the Bitcoin Cycles era and begin a new phase where bull markets last 10 years and bear markets 5 for example.
The final point to make here, we all have this information right in front of us, the network works and continues to grow stronger, governments are adopting Bitcoin, Gary Gensler marks it as a commodity, the largest institutions in the world have noted they are going to allocate with their funds and with clients once regulations finish the frame work.
Fidelity 4.5 trillion USD AUM
Blackrock 10 trillion USD AUM
Charles Schwab 7.13 trillion USD AUM to name a few
I see projections for cycles that even out around 2040, but what if this happens in 2030? that would mean a gigantic parabolic move comes before 2030 and Bitcoin could be in a bear market till 2035, 2020-2021 based on history with Bitcoin was the smaller cycle, the next cycle should be bigger and possibly could be the last.
Good luck and HODL.

Buying Costco at a discount. COSTTriangle/Three drives within an upgoing zigzag. We more often now base stop loss off a moving ATR, as testing had shown this to be a more effective strategy than mere price levels alone. Yet, ATR is not always an option.
We are not in the business of getting every prediction right, no one ever does and that is not the aim of the game. The Fibonacci targets are highlighted in green with invalidation in red. Confirmation level, where relevant, is a pink dotted, finite line. Fibonacci goals, it is prudent to suggest, are nothing more than mere fractally evident and therefore statistically likely levels that the market will go to. Having said that, the market will always do what it wants and always has a mind of its own. Therefore, none of this is financial advice, so do your own research and rely only on your own analysis. Trading is a true one man sport. Good luck out there and stay safe.

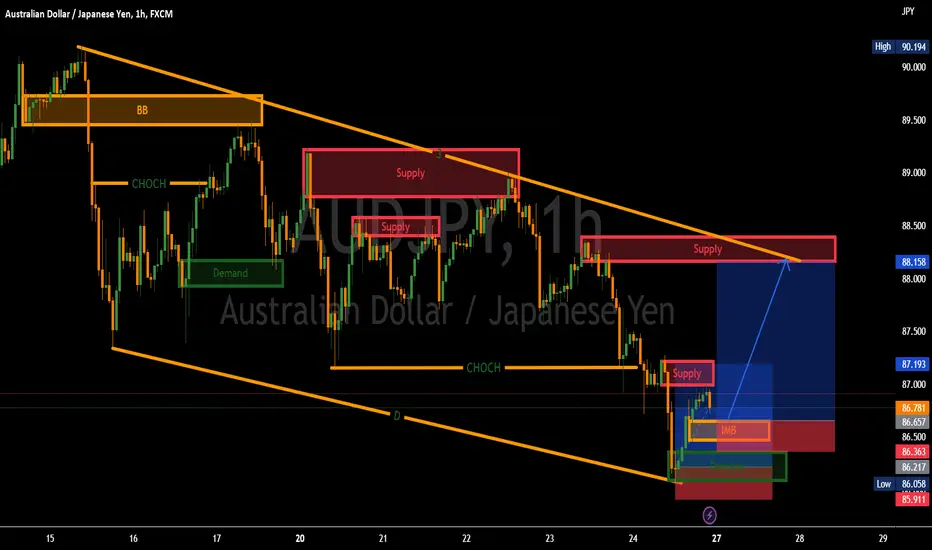
Bearish order flowThis market structure is characterised by lower lows and lower highs, therefore it is a bearish order flow. After the divergence occurrence nor the diagonal liquidity grab, the market took an impulsive bullish turn which is now being rejected by the middle supply zone. From here price could correct the imbalance or break below to mitigate the demand zone and shoot up to level 88.158. The main focus and priority is to seize this potential bullish opportunity and buy all the way up to the supply zone which will simultaneously provide the descending third touches…
📈BTC scenarios during FOMC decision📉BINANCE:BTCUSDT
COINBASE:BTCUSD
Bitcoin analytical series S01E09
Hello traders, don't forget to risk-free your positions.
Long targets ----> above Green lines.
Short targets ----> below Green lines.
Please share ideas and leave a comment,
Let me know what's your idea.
CrazyS✌

Fair value gap dropWe have this wedge that created falling three drives in which the third touch simultaneously triggered the 4h breaker block. There’s a piercing line candlestick pattern which indicates strong buying pressure. With so many significant areas highlighted, the initial target is 134.732…

A wedge in placeThe market started off with accumulation phase to provide this nice bullish drive and got rejected by the 4h fair value gap. Then price dropped to the order block, respected the area and formed a young bearish order flow to give us the descending three drives which also created three ascending bullish drives. Both the drives have created a retail pattern which is narrowing to create high chance of a volatile move. Expecting a bullish move from this situation because on the 4h timeframe we have more of a correction that await an impulsive bullish move. Anticipating price to break above the 0.93454 to the 0.93926 stop order…

A complete analysis of XAUUSD (gold)hello guys... are you okay?
Today, I want to analyze gold and look at its past to see what has happened. I noticed that after a sharp movement, a three drives pattern formed, followed by an engulfment of the last drive to form a QM pattern. At the same time, a double bottom was also formed, which led to the target being reached. However, I believe that gold now needs to undergo a correction of at least 0.33 of the last move.
I have considered two scenarios for this situation, and every area that gives confirmation in the 15-minute time frame is being monitored. I am currently waiting for further developments and confirmation before making any decisions.
However, it's important to keep in mind that technical analysis is not always accurate and market movements can be unpredictable. It is essential to consider other factors such as market sentiment, news, and overall market trends before making any trading decisions. It is always a good idea to have a proper risk management strategy in place and to seek the advice of a professional financial advisor before making any investment decisions.

Bullish urgeAt first the market provided three ascending drives, pushed up, respected the fair value gap and dropped to the order block support. Accumulation phase occurred before the volatile move to the breaker block, now price made a retest to the phase. From here we should expect a bullish move to the inner supply zone, the urge is to buy…

Order flowThe daily chart has the characteristics of a volatility contraction approach, price has now invalidated the contraction and we’re up for a volatile move.
4h timeframe shows that the bullish three drives were in accordance with the bullish order flow. This breakout made a small retest to the daily order block and fell to the demand zone, with this current candlestick it looks more like price respects the area and we should be ready for a full pullback to the order block.
Now it’s clear that the bearish move has lost its momentum, the immediate target is the order block then we go long with this potential and long bearish move the liquidity area at 87.047…

Successful retracementFrom the 137.911 level, the market made a successful retracement to the demand zone at 135.854 and couldn’t push up to the main supply 137.678 because of the previous broken structure. The rejection formed this current mid supply area and price made an impulsive drop that broke the structure and created divergence at the 134.109 low. The market is now trying to recover the massive drop, so we now target the breaker block which was our previous demand zone then expect a young bearish move to give us the ascending second drive to provide more bearish move as we await the third drive. The ultimate target is 137.678, provided that we get the anticipated third touch…
