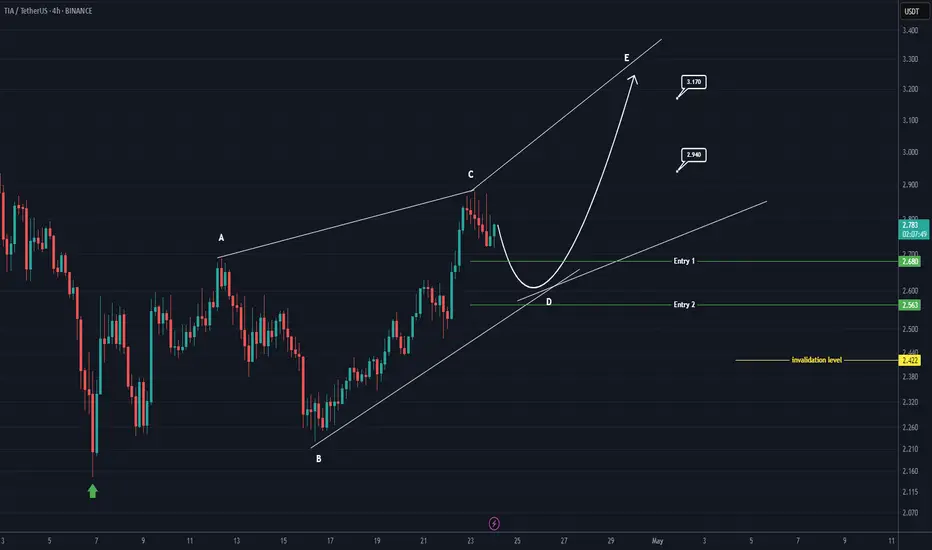
TIA buy/long setup (4H)TIA seems to be in the middle of a bullish pattern, especially as it has reclaimed key levels and there is an order block located below the current price.
Two entry points are marked on the chart, indicating where we’re looking for buy/long positions.
Targets are specified on the image.
A 4-hour candle closing below the invalidation level would invalidate this setup.
For risk management, please don't forget stop loss and capital management
When we reach the first target, save some profit and then change the stop to entry
Comment if you have any questions
Thank You
TIA
#TIA/USDT#TIA
The price is moving within a descending channel on the 1-hour frame, adhering well to it, and is heading towards a strong breakout and retest.
We are experiencing a rebound from the lower boundary of the descending channel, which is support at 2.18.
We are experiencing a downtrend on the RSI indicator that is about to be broken and retested, supporting the upward trend.
We are looking for stability above the 100 Moving Average.
Entry price: 2.27
First target: 2.36
Second target: 2.42
Third target: 2.53

TIAUSDT Bottoming Out?TIAUSDT Technical analysis update
TIAUSDT has been trading within the longest descending channel. The price has once again touched the channel support and also retested the November 2023 support level or bottom. A strong bounce from this zone is likely, and we could potentially see a 100–150% move from the current level.

TIA: Crazy Risk to Reward Ratio#Tia faced steep losses since Dec 2024, underperforming similar coins.
Now near its ATL, it presents a high risk-to-reward setup.
Below $2.10 is the stop-loss, while passing above $3.80 signals a bullish reversal in trend with higher targets ahead.
#Celestia
9 month liquid venture betsBe Greedy When Others Are Fear Full - Buffet
-- First post. Take it with some salt. --
Nothing in this post is investment advice. It’s barely even coherent thought. I own random coins, have exposure to stuff I forget about, and might be wildly conflicted without realizing it. Assume I’m biased, assume I’m losing money, and most importantly: assume I will sell everything without telling you the second I feel like it. Always do your own research, or better yet — stop reading, it will likely waste your time anyways.
Key takes:
Macro fear is fully priced — dislocations create asymmetric upside opportunities.
Liquidity conditions remain supportive — policy catalysts can trigger sharp repricing.
Infrastructure plays in cross-chain messaging and modular blockchains are left for dead but inevitable.
Cultural assets represent a new frontier for community-driven value creation.
Global macro markets have been crushed. Trade wars and peak recession fears have fully reset positioning. Equities crashed hard, bounced even harder — but sentiment is still dead. To me, this is not the moment to turn bearish. This is exactly the moment to start looking the other way.
The S&P 500 dipped 21%. Nasdaq dipped 25%. Bitcoin dipped 31%. Others (crypto outside of top10) dipped as much as 61%. Maximum fear is priced in. Recession seems consensus.
But behind the scenes?
U.S.–China trade dialogue has resumed.
Policymakers globally are preparing stimulus.
The Fed pivot may be closer than markets expect.
When positioning is light, sentiment is exhausted, and policy shifts — markets don’t wait. They rip.
It’s not about what today’s headlines say — it’s about what the next headlines will be.
And it’s not about whether outcomes are positive or negative — it’s about whether the current market psychology is underestimating or overestimating what’s coming.
Tariff expectation → too bearish
Trump chaos → Overestimated
Skilled technocratic cabinet → Underrated
Rate cuts → Expectations too low
Deregulation impact → Underestimated
Lower taxes → Invisible but real
CrossBorder Capital’s Global Liquidity Index (GLI) seems to confirm it: liquidity isn’t done yet, we have approx 9 months left — and risk assets tend to perform best at the end of the liquidity cycle. Given that — and considering the main viral narratives dominating the crypto headlines for months now:
VC's scams don't work anymore
Oversaturation of projects, their will never be enough demand.
These coins will never justify there revenue
Frequent and poorly managed token unlocks will crush the prices
Pump.fun destroyed retail demand
My response would be:
At some point things will be priced in and prices trade below there value. When that happens — even the few holders still up on their position won’t be willing to sell anymore. There’s always that moment — nobody expects it — where supply dries up, the market reverses, and sentiment is (as always) slow to catch up.
Just before everyone sees it, a great leap of faith is needed.
Right now, three major themes are left for dead — DFV:
1. Cross-chain messaging (deep tech)
USDT0 Tether, WBTC, Berachain, Monad, Telegram, Ethena, Aptos, Movement, PayPal, Wyoming, Eigenlayer, Pumpfun, HyperEVM... and I’ve likely missed many names that are benefiting from the market leader crosschain infrastructure— this is still just the beginning. Demand for omnichain communication is growing fast and LayerZero is the main protocol. Billions transferred cross-chain for cents. Study OFT.
COINBASE:ZROUSD Great team backed by world-class investors, already in use, and moving fast.
2. Modular blockchain architecture (deep tech)
Market leader Celestia soon offers what Ethereum’s roadmap hopes to deliver years from now: scalable data availability + ZK-proof compatibility.
COINBASE:TIAUSD The space is converging. The architecture is maturing.
3. Movement Coins / Neo-religions
After the Pumpfun craze, the majority will be hunting for something similar but different.
Memecoins like SPX6900 transcend speculation, evolving into cultural movements or "neo-religions." They channel financial nihilism and the last hope for retail into community-driven protests against traditional systems — offering hope and belonging.
CRYPTO:SPX6USD (special thanks to my bro for sharing this one)
If one is positioning The radical portfolio strategy for these liquid venture bets could look something like:
70% Deep Tech / 30% Movement Coins.
-
This content is for informational purposes only and does not constitute investment advice, an offer, or a solicitation to buy or sell any financial instrument. The views expressed are those of the author and are subject to change without notice. Any investment strategies discussed herein are high-risk, speculative in nature, and are not suitable for any investors. Always conduct your own research and consult with a licensed financial advisor before making investment decisions. Past performance is not indicative of future results.

Is TIA About to Break Down Hard? Traders Beware Before It’s lateYello, Paradisers! Did you catch the recent bullish rally on #TIAUSDT? It’s been delivering solid gains over the past couple of days, giving traders reason to celebrate. But what if we told you that this rally might just be setting up a classic trap—one that smart money is already preparing to take advantage of? The technical structure forming right now suggests a high probability of a reversal, and if you’re not paying attention, you might end up on the wrong side of the move.
💎#TIAUSDT, at the core of setup is a developing a probable Bearish Gartley pattern. These harmonic structures are rare but extremely powerful when they align with multiple technical confirmations and that’s exactly what we’re seeing here. With the recent move upward, TIAUSDT appears to have completed its C leg, a critical part of the Gartley structure. This sets the stage for the D leg, which typically completes much lower. The price reacted strongly from the C leg area, which also happens to line up perfectly with a previous local high adding even more probability to the resistance at that zone.
💎This resistance isn't just horizontal there's a dynamic element at play as well. The 21-period EMA on multiple timeframes is currently acting as a ceiling for price action. When a key moving average starts rejecting price repeatedly, it often signals that the current trend is losing steam and this dynamic resistance only strengthens the case for a downside move from here.
💎Looking deeper, the bearish signs are confirmed by momentum indicators. The RSI on lower timeframes is not only overbought but also showing clear signs of bearish divergence. This divergence occurs when the price continues to make higher highs while RSI starts forming lower highs a classic sign that momentum is weakening. It’s one of the more reliable early warnings that a reversal may be near. In this case, RSI is flashing that warning now, suggesting that buyers may soon run out of fuel.
💎If this bearish probable scenario plays out as expected, the first key level to watch on the downside sits around the 3.278 zone. This minor support may offer a temporary bounce, but if the D leg of the Gartley is to be completed, we could see even deeper price action. This makes the current area extremely sensitive—any weakness from bulls could trigger a fast move downward.
💎However, no pattern is complete without an invalidation level, and for the Bearish Gartley, that comes in around the 3.805 resistance zone. A strong, sustained close above this level would invalidate the bearish setup and signal renewed bullish momentum. Until then, all technical signals are pointing toward caution, especially for those still riding long positions without a tight risk plan.
Stay alert, Paradisers. The market is about to decide. This is a textbook moment where emotions can take over, and late buyers get punished for chasing green candles. That’s why, we are playing it safe right now. If you want to be consistently profitable, you need to be extremely patient and always wait only for the best, highest probability trading opportunities.
MyCryptoParadise
iFeel the success🌴

TIAUSDT 3DTIA ~ 3D Analysis
#TIA Key support that must be maintained. Loss of this support, LSE:TIA price will be more depressed lower.

TIA | Next Altcoin to MOON ??In the macro, it's clear that TIA has been in a downward trend for an extended period of time. This means, it's a great place to buy - because the bullish cycle is up next.
In an earlier publication, I made an update about the ideal entry point for TIA:
A key indicator to watch is the daily timeframe, when the price begins to trade ABOVE the moving averages - that's when you'll have the first confirmation of a bullish turn around. It is a bullish sign to see the gradual higher lows.
Moving Averages:

TIA ( SPOT)BINANCE:TIAUSDT
TIA / USDT
(4H + 1D) time frames
analysis tools
____________
SMC
FVG
Trend lines
Fibonacci
Support & resistance
MACD Cross
EMA Cross
______________________________________________________________
Golden Advices.
********************
* Please calculate your losses before any entry.
* Do not enter any trade you find it not suitable for you.
* No FOMO - No Rush , it is a long journey.
Useful Tags.
****************
My total posts
www.tradingview.com

TIAUSDT – Weak at Key Weekly Level! More Downside Ahead?TIAUSDT – Weak at Key Weekly Level! More Downside Ahead?
“This chart looks weak—momentum favors the downside. But is there a bounce first?”
🔥 Key Insights:
✅ Sitting at a Critical Weekly Zone – A breakdown here could be brutal.
✅ Momentum Looks Bearish – No real strength from buyers.
✅ Only Considering Low-Risk Buys – Fibonacci Green Zone (0-0.5) is the ideal cheap area.
💡 The Smart Plan:
Looking for a Break & Retest Downward – If support cracks, shorts become clear.
Small Risk Buys from the Fibonacci Zone – Only for aggressive traders.
CDV & Volume Profile Must Confirm – No buyers? No trade.
“Weak price action, heavy risk. Only the right levels matter here—watch closely!” 📉🔥⚠️
A tiny part of my runners;
🌊 WAVESUSDT.P: Demand Zone Potential
🟣 UNIUSDT.P: Long-Term Trade
🔵 XRPUSDT.P: Entry Zones
🔗 LINKUSDT.P: Follow The River
📈 BTCUSDT.P: Two Key Demand Zones

TIA | PERFECT Bottom??In the macro, it's clear that TIA has been in a downward trend for an extended period of time. This means, it's a great place to buy - because the bullish cycle is up next.
Trend based indicators are great to identify the immediate predominant pressure on the chart, in this case, bearish. A "Buy" signal in the weekly timeframe would be the first step in the right direction (reversal).
Trend Based Indicator:
Another key indicator to watch is the daily timeframe, when the price begins to trade ABOVE the moving averages - that's when you'll have the first confirmation of a bullish turn around.
Moving Averages:
______________________
BINANCE:TIAUSDT

Breaking: $TIA Surges 17% Eyeing A Move to $5 The first modular blockchain network that enables anyone to easily deploy their own blockchain with minimal overhead by rethinking blockchain architecture from the ground up broke out of a falling wedge patten soaring 17% albeit the crypto market is highly volatile with CRYPTOCAP:BTC reclaiming the FWB:83K pivot.
Celestia Network Native token ( LSE:TIA ) has shocked the mainstream crypto market after breaking out of a falling wedge escaping the gasp of the support point holding it at the $2 zone.
With building momentum, LSE:TIA is eyeing a move to the $5 zone should it break the $4 resistant zone a move to the $5 target isn't far-fetched. With the Relative Strength Index (RSI) at 58, LSE:TIA is poised for a bullish run should the crypto market stabilize.
Celestia Price Live Data
The live Celestia price today is $3.74 USD with a 24-hour trading volume of $220,357,891 USD. Celestia is up 17.41% in the last 24 hours. with a live market cap of $2,091,803,371 USD. It has a circulating supply of 558,964,944 TIA coins and the max. supply is not available.

TIA Looking Good To Short Failed Break Down Of Raising Wedge TIA Looking Good To Short Failed Break Down Of Raising Wedge Not Looking Good Potential For Breaking Out But It's With Less Risk Play Simple And Profitable

Celestia TIA price analysis🟣 For the second day in a row, the LSE:TIA price is showing growth
But would we risk buying OKX:TIAUSDT now - rather no than yes...
🟡 Above the orange trend line, purchases will be safer.
🟢 And during the $3 retest in the blue scenario, it's even safer)
Although, in the medium term, seeing #Celestia at $9 again is more than a realistic task.
_____________________
Did you like our analysis? Leave a comment, like, and follow to get more

TIA Trade Setup: Potential Double Bottom FormationWith seller exhaustion possibly setting in, TIA is shaping up for a double bottom formation. If price deviates from launch levels and confirms a market structure shift, we could see a strong upside move.
🛠 Trade Details:
Entry: Around $4.00
Take Profit Targets:
$5.50 (First TP - Key Resistance Zone)
$7.10 (Second TP - Breakout Level)
$9.00 (Third TP - Full Expansion Target)
Stop Loss: Below $3.00
Keeping an eye on volume confirmation and resistance reclaim before full conviction. 🚀

Celestia Short-Term Bullish Target Goes Beyond 200%This is another pair that is bullish and is now about to produce a strong advance while Bitcoin crashes. Bitcoin isn't going any lower, or, I should say, TIAUSDT is about to move up.
TIAUSDT is trading above EMA8 and EMA13 on the daily timeframe.
The previous peak happened in February 2024.
The most recent bottom happened in February 2025. That's a full year of bearish action.
There was a strong correction in the form of a bearish impulse. This bearish impulse was followed by a sideways market. The sideways market produced a small bullish breakout and later a lower low to reach this present day. Present day, TIAUSDT is bullish and about to go up. The targets can be found on the chart. Here we have an easy 216% target and up to 378% short-term.
Thank you for reading.
Namaste.

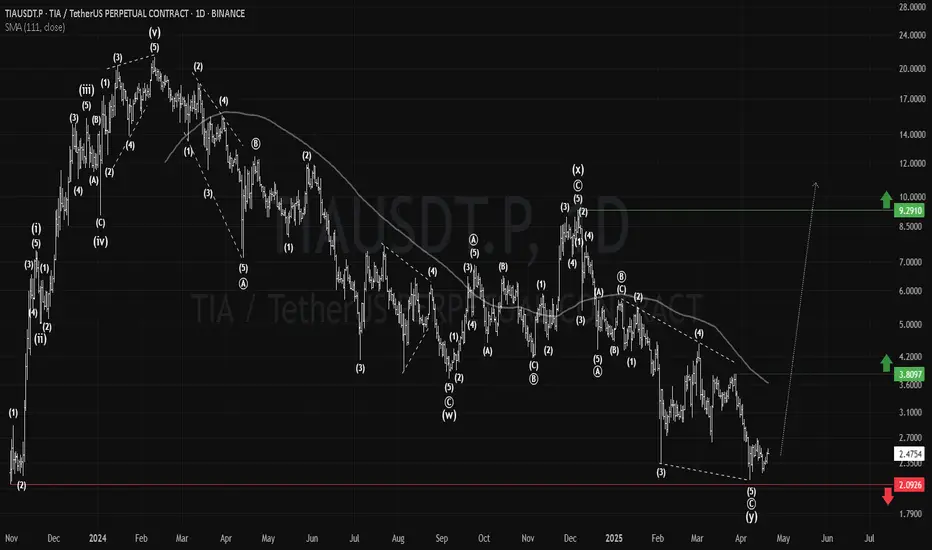
TIA 3DLSE:TIA 3D;
It continues its course just above the discount level and at the same time continues its movement towards a strong wedge contraction.
In order for an uptrend to start, a daily close above $5.7 is needed in the first place. In order to say that the main trend has returned, a closing above $9.3 is required.
#celestia #tia

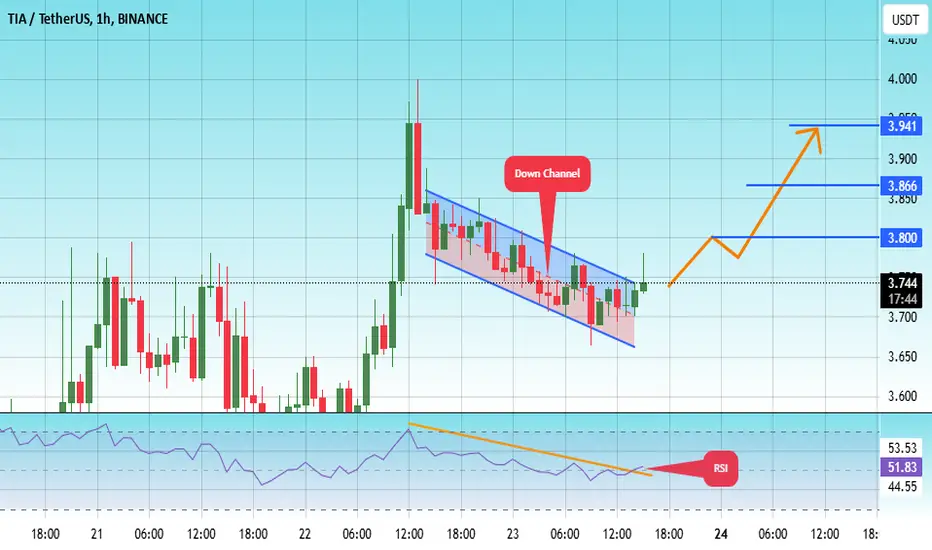
#TIA/USDT#TIA
The price is moving in a descending channel on the 1-hour frame and is adhering to it well and is heading to break it upwards strongly and retest it
We have a bounce from the lower limit of the descending channel, this support is at a price of 3.67
We have a downtrend on the RSI indicator that is about to break and retest, which supports the rise
We have a trend to stabilize above the Moving Average 100
Entry price 3.74
First target 3.80
Second target 3.86
Third target 3.92
TIA target $5.64h time frame
-
Entry: $2.96
TP: $5.64
SL: $2.66
RR: 8.77
-
(1) TIA is still correcting and building the bottom structure after dump on 3rd Feb.
(2) Double bottom is one of the possible structure, the potential right leg is $2.9
(3) Fibonacci provides first target at $4.5 and final target at $5.6
(4) Stop loss once going below $2.66

TIA - Long Trade IdeaTIA could shoot up to 3.9–$4, but would love to see a retest at $3.30–$3.50 afterward for possible long re-entry
Targets:
$3.90
$4.38
$4.84
Stoploss below $3.14

TIA/USDThello friends
According to the arrival of buyers, we can enter into the transaction with capital and risk management.
*Trade safely with us*


TIA/USDTThe coin is in consolidation, and the January low was taken out with a manipulative move (deviation). This can be considered as an AMD setup. Growth targets:
Target 1 = 5
Target 2 = 5.7
