TIA/USDT – Major Breakout Incoming? Reversal in Sight!🔍 Full Technical Analysis (1D Timeframe):
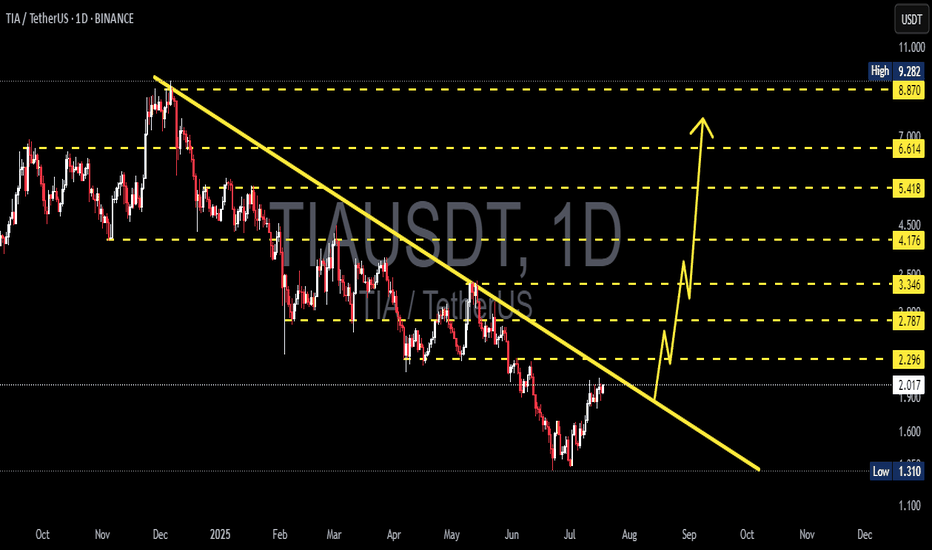
TIA/USDT is approaching a critical turning point after experiencing a strong downtrend since December 2024. The chart clearly forms a Falling Wedge pattern — a classic bullish reversal signal known for explosive breakouts when confirmed.
Currently, the price is testing a key confluence zone around $2.00 – $2.30, where:
A major horizontal resistance meets
A long-term descending trendline (yellow), acting as dynamic resistance since the last local high.
🚀 Bullish Scenario (Confirmed Breakout):
If TIA successfully breaks and closes above the $2.30 – $2.78 range with strong volume, it could trigger a major mid-term rally. The potential upside targets are aligned with previous structural resistance levels:
Target Resistance Level
🎯 Target 1 $3.34
🎯 Target 2 $4.17
🎯 Target 3 $5.41
🎯 Target 4 $6.61
🎯 Target 5 (Extended) $8.87 – $9.28 (Major Weekly Supply Zone)
✅ Additional Bullish Confirmation: A volume breakout + RSI moving into the 50–70 zone would strengthen the bullish case.
🛑 Bearish Scenario (Fake Breakout Risk):
If the price gets rejected again from the descending trendline and fails to close above $2.00, the bearish pressure may push the price back toward key demand zones:
First support zone: $1.60
Last major defense: $1.31 (the current swing low)
This could lead to a double bottom structure before any meaningful trend reversal happens.
📐 Pattern Breakdown:
Pattern: Falling Wedge Breakout Pattern
Duration: Over 7 months of consolidation below trendline
Risk-to-Reward Potential: Highly favorable if breakout is confirmed
🧠 Market Sentiment:
Many altcoins are showing early signs of bottoming out and accumulation.
TIA could become a breakout leader in the next wave if it clears the current resistance cluster.
Expect momentum traders to join in once a solid bullish candle closes above the wedge.
✅ Conclusion:
TIA/USDT is at a technically golden level. A breakout from this falling wedge structure could ignite a multi-stage rally. However, caution is advised: wait for a confirmed breakout and manage risk in case of a failed breakout attempt.
#TIAUSDT #CryptoBreakout #FallingWedge #AltcoinRally #ReversalPattern #BreakoutTrade #CryptoTA #MomentumTrade #Altseason #TechnicalAnalysis #CryptoSignals
Tiausdtbuy
TIAUSDT Bottoming Out?TIAUSDT Technical analysis update
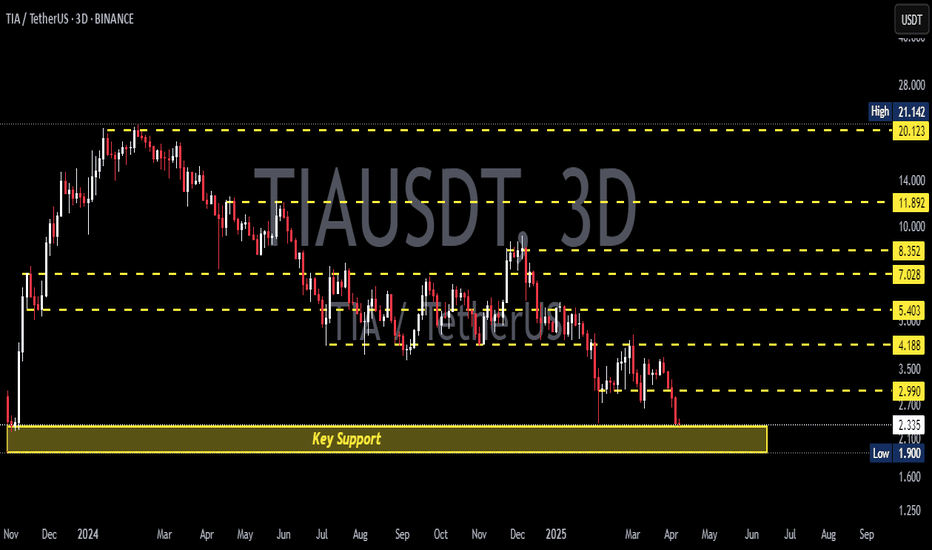
TIAUSDT has been trading within the longest descending channel. The price has once again touched the channel support and also retested the November 2023 support level or bottom. A strong bounce from this zone is likely, and we could potentially see a 100–150% move from the current level.
$TIAUSDT on the Brink – 4.6 Accumulation for Big Moves to ATHsBINANCE:TIAUSDT Bottoming Out – Accumulating Below 4.6 for the Breakout
Looks like BINANCE:TIAUSDT is bottoming here, but it might take a couple of weeks for a breakout.
I’m patiently accumulating under 4.6. The daily hasn’t triggered a signal above 5.5 yet, so no rush to add above my current buy zone.
Last time I was expecting new ATHs, so this time I’ll chill and just call it – Our final stand towards ATHs 😂
Solid setup, just needs time.
TIAUSDT Breaks Resistance: Strong Bullish Move AheadTIAUSDT Technical analysis update
TIAUSDT has been consolidating for the past 160 days, repeatedly testing the trend resistance line. Today, the price broke above the resistance line on the daily chart and crossed above the 100 EMA. A strong bullish move is anticipated in the coming days.
Buy zone : Below $6.30
Stop loss : $5.32
Take Profit 1: $7.10
Take Profit 2: $8.50
Take Profit 3: $11.85
#TIA/USDT#TIA
The price is moving in a descending channel on the 1-hour frame and is sticking to it well
We have a bounce from the lower limit of the descending channel and we are now touching this support at a price of 4.20
We have a downtrend and the RSI indicator is about to break, which supports the rise
We have a trend to stabilize above the moving average 100
Entry price 4.20
First target 4.63
Second target 4.98
Third target 4.43
TIAUSDT Bullish (1H Divergence, Harmonic Reversal Pattern)TIAUSDT price action shows bullish bias with a confirmation of price reversal based on 1H Divergence and Harmonic Pattern. Price is at the reversal zone and most likely it will reverse back.
Trade Plan
SL @ lower low
Entry @ previous LH
TP1 and TP2 @ 1:1 and 1:2 risk and reward


