BTCUSD: Weekly trend continuation signalWe might get a nice move out of this juncture. #BTCUSD formed an accumulation level here, potentially, and already flashed a daily and then weekly trend signal. Targets are the cyan boxes, and in a very extreme case the red box target. I personally think it might not break higher than 2019 highs, hitting resistance near 12150, but, I will go with the flow here. Already long from a tad lower, and also in a few altcoin positions with 30% of the portfolio as well for a few days.
I can see the total market cap rising 35% roughly, within the next few weeks.
This signal aligns with the #XAUUSD chart I posted as well, and with the idea of #SPX breaching the previous all time high before seeing a drop again. If the market is sideways for 9 years like yearly Time@Mode charts suggest, a perfect sideways enviroment would be one where we reverse after trapping everyone on fake breakouts...
In the case of #XAUUSD, this might be a very extreme sentiment peak once it breaches 2011 highs. I'm looking forward to it.
Keep an eye on the inverted head and shoulders crowd, many people like some particularly notorious veterans who use classical TA patterns will spot one once we break out over 10500, if we do. And this pattern will give them a pretty lame target of 17k , which I think won't be hit given the current macro situation. Would be good to sell our coins to the guys counting on that happening before it drops...Keep an eye out for that, sentiment should turn mad bullish again near the top.
Best of luck to all my followers and clients.
Cheers,
Ivan Labrie.
Timeatmode

XAUUSD: hit the highest weekly low since 2011 and down...It's possibly over for a while, for gold, a weekly trend expired last week and it hit a massive resistance and was rejected. If you hold the yellow metal, you are better off selling it for USD here. Doesn't look promising in the slightest, and inflation is highly unlikely to materialize, despite the huge money printing we saw after the Coronavirus induced crash. I think this is it for gold, get out before it's too late.
I would happily buy it after a big enough fall...
Cheers,
Ivan.

NKLA: Huge upside with low riskWe have a nice setup in #NKLA here. I'm already long from lower, but looking to add some exposure to ride this move.
I'm overall impressed with the huge short interest in the stock, it pays off to hold shares in a margin account and lend them to short sellers, while benefiting from this trend.
You can do this with certain brokerage firms that share part of the borrowing costs with share holders, as long as they sit in a margin account, like IBKR for instance.
That said, fundamentals for the company are at the very least interesting, although largely unproven. The CEO does have a big mouth and makes bold claims, but he has a few interesting things to say. I'm giving him the benefit of the doubt with a small position in the stock. Try to keep risk in check...Hydrogen generation is quite low cost, and the long distance efficiency of an EV truck with a relatively light weight FOOL cell I mean fuel cell, is an interesting and potentially profitable proposition. $TSLA is still king when it comes to EV cars though, but good to see some competition in the field.
Cheers,
Ivan Labrie.

USOIL: Likely a top by now...The same pattern is visible in $DXY and all major pairs, as well as in $SPY. The recent bullish trends we had are peaking, and already show a reaction right after FOMC.
I would assume oil will go back down, retracing at least half of the surge from $0...
Entering shorts near resistance here might pay off, or at the very least, being aware of this trend to trade pairs that are correlated to oil like $USDCAD and $USDNOK, or $USDMXN, or simply shorting some energy stocks.
Keep an eye on it here, if the high holds, it's likely to fall from here for a while.
Cheers,
Ivan Labrie.

Dax: Potential top here...There's a nice short setup with defined and low risk in the Dax here. You can trade it with futures or CFDs, the stop is tight, you could use a stop over 12933 here for instance.
The recent daily uptrend signal that triggered 3 weeks ago ran out of time, and now we had a bearish reaction to resistance. Sentiment is getting out of hand, and there are very extreme things happening with euphoria from retail...FOMC might be a catalyst for a top for a while.
Cheers,
Ivan Labrie.

TLT: Big down trend started#TLT has finally triggered a bearish signal here in the weekly chart. It has some good downside potential, but eats up a ton of cash if you short shares. Keep that in mind...
Cheers,
Ivan Labrie.

USDCAD: Trending downIt seems the $CAD will regain strength here. The dollar printing and spending is starting to show up in currency charts and bond yields, whereas for now it was only reflected in the price of Gold, Bitcoin and Stocks. It'd be interesting to capture upside in commodities and commodity related plays, apart from the other stores of wealth I mentioned above. On the way down there is a level that can act as support and slow down the fall, near target one for this signal, so probably then we see a sideways range before further downside in the Dollar.
This is more of an analysis piece rather than a trade entry since the ideal entry is late by two days. But good info if you're holding longs or shorts in this pair.
Cheers,
Ivan Labrie.

Corn: Long corn, stop short...I'm actually talking about the real commodity here. Interestingly it has a nice base and daily trend signal here, which has decent upside vs risk.
I'm long since last Friday, near the open using July corn futures. Looking for a move towards the target on chart in time.
This could be a major bottom, so, probably interesting to see if we can keep a part of the trade running for longer, provided it forms a continuation signal after hitting the target zone.
Cheers,
Ivan Labrie.

TX: Ternium is a huge buy here...I think $TX shares are likely to benefit from increasing inflation and higher interest rates in their target markets, caused by the huge money printing and govt spending needed to survive the Coronavirus induced recession. As activity picks up, construction in these markets will be a very profitable endeavor, specially as real estate prices tend to go mostly higher due to the terrible combination of high interest rates and high inflation in these EM nations. Additionally, steel itself is likely to go up due to the infinite QE effect over time as well.
Valuation for $TX was very attractive recently, and I've been buying it for some time. Currently one of my favorite stock ideas.
To get more ideas like this one, contact me for details on joining my signals service trial for one month, free of charge.
Cheers,
Ivan Labrie.

Pair trade idea: short #QQQ and long #SPY 1:1I think this ratio is bound to go lower here, should be a good trade to put on, roughly 33% size needed to get a good enough exposure to it. It is capital intensive so it is probably easier to do with futures contracts.
Cheers,
Ivan Labrie.

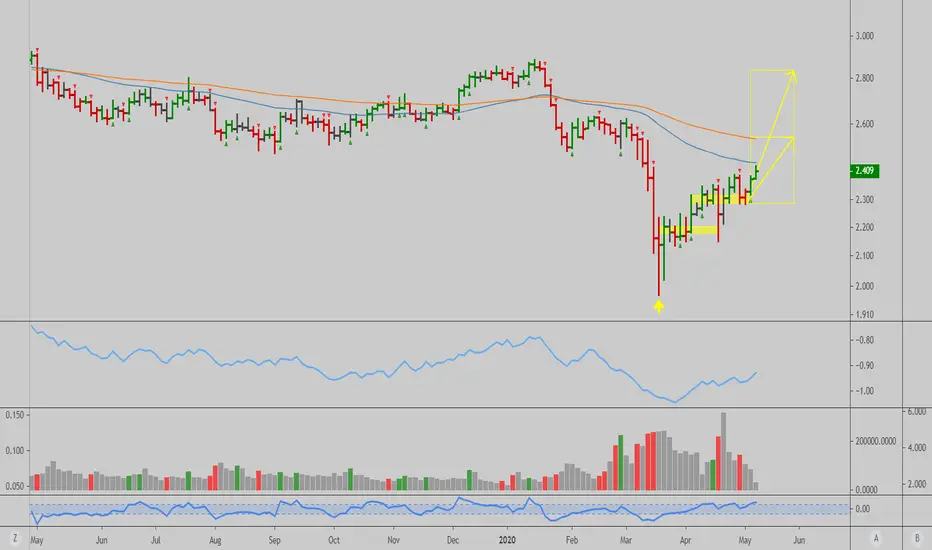
Copper: Inflation is manifested in asset prices...for nowCopper is acting strong here, so far the 2 day timeframe had captured a good rally here, and subsequently spotted the bottom of the correction after it hit the target. There is another signal active here, similarly to the price action shown in stocks. I expect copper to rally until the end of May easily, upside targets are on chart and are valid while it holds over 2.288 or time runs out, whatever happens first.
Ray Dalio's cash is trash idea is starting to materialize (albeit a bit too early sadly for him).
Cheers,
Ivan Labrie.
#SPX: Trend is up...With everyone so damn bearish since the bottom, it has been clear to me we have been climbing a huge 'wall of worry'. The daily chart shows #SPX can rally for two weeks+ here, peaking for some time when retesting potential supply near the top (see the bright red boxes).
We should see the economy starting to open up gradually, overall we had a intense rally in many tech stocks but not so much in other 'real economy' names, which are likely to catch up soon. I'm positioned with overweight value, but also own some growth names that can still rally higher. Overall, the logical thing to do is to be long assets, given the Fed's actions. Cash is indeed trash now (Dalio had it a bit too early).
Cheers,
Ivan Labrie.

XAUUSD: Gold might break the all time high...I'm talking about the inflation adjusted chart high of 1980, not 2011...It seems this is the first big yearly time@mode signal in it since the bottom in 2001. The highest low resistance zone in the yearly chart, from 1980 had kept price subdued for years but the recent measures introduced to fight off the Coronavirus induced crisis and societary cost will have an effect on the value of money globally I suspect. Good time to be long in scarce assets like #gold and #bitcoin.
The margin call induced crash in #XAUUSD is a good chance to load up, it seems to have held support in the weekly #XAUUSD chart, and might reload for another strong move up soon. Max long term risk is 13% if you go all in, so factor that in for position sizing in long term entries. Stops are not easy to place, but should not drop more to hold it, give it some wiggle room but don't hold on to it if it drops more than 3 times the daily average true range from here.
Cheers,
Ivan Labrie.

BTCUSD: Update, weekly trend signal activeBitcoin has confirmed a weekly chart uptrend signal here. Me and my clients are long with a pretty low cost basis, sub 6k, recently reentered longs at 7830.
Demand seems to be surpassing supply here, which is a bit surprising considering the efforts I feared large miners might be doing towards gaining market share by eliminating weaker miners running older hardware from the market. They either aren't going for it, or demand is far more than they can cope with.
This article shed some light in mining dynamics at play but I expanded on the analysis for my own study of fundamentals: www.blockwaresolutions.com
After the halving break even levels for miners will double, making it easier to wipe out S9 miners, if below the majority of their break even levels for long enough after the halving takes place.
See the levels of break even for S9 miners below, together with the % of the network they represent (these are tiered per energy cost levels):
5136 4.5%
7704 5.63%
10272 9.75%
12840 7.5%
14124 6%
15408 3%
16692 1.25%
19262 1%
With my chart target between 11816 and 13600, we would see a hash rate reduction between 18.75% and 11.25% by the end of June.
That means we can expect supply to wane after those dates, which is the time needed to finally get rid of these inefficient miners if we rally.
Demand certainly is strong otherwise larger miners would have preferred to keep price below 7700 until those dates, getting a FAR larger hash rate reduction and thus market share gain for themselves.
From this point, if we hit those targets, with a reduction in inflation and market selling pressure from close to bankruptcy miners, price can break free and rally long term again. I estimate that we may trigger a long term signal by the end of June if all goes well, which would imply a rally as I had originally envisioned, with prices heading towards 42k to 280k over time, although at a much slower pace. Let's go step by step. There is also a chance CME short sellers return with a vengeance and stop the advance near 9600 together with miners selling futures and mined coins and reserve btc to kill price once again.
We will have to wait and see...I will, as usual, try to dodge any possible drop, and manage to make some huge gains in this market over time.
As a sidenote, see related ideas for the short signal I had posted, the target was the bottom in fact. Minimum upside implications is retesting 9950 as per that chart.
Cheers,
Ivan Labrie.

T-Bond futures peakedThe weekly chart shows the recent surge is likely topping, and might start falling between now and the next 3 weeks probably. Fundamentals favor a decline as governments go into spending binges to counteract the virus induced crisis. @timwest pointed out this short idea recently, props to him for spotting it. I do like how wild the disconnect vs #Gold is now, might be interesting to look into trading the spread soon.
As a sidenote, the asset classes that sold off while this rally was occurring might turn around by the 2nd week of April (like stocks and #Bitcoin).
Cheers,
Ivan Labrie.

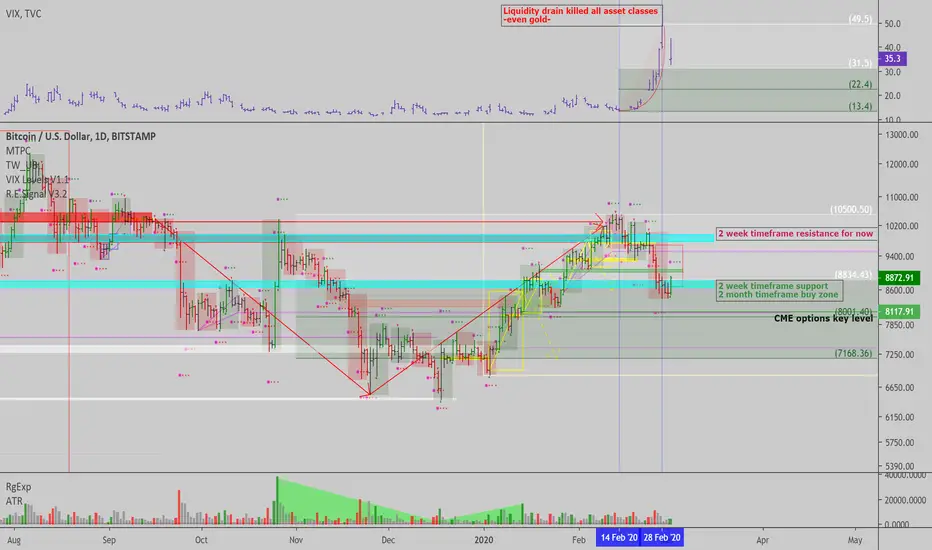
BTCUSD: Hodlers will capitulate, peak 'Brrrrrr' stupidity...I suspect the weekly down trend will extend towards the downside target suggested by the monthly timeframe here. Since the Fed announced their 'whatever it takes / infinite QE' approach towards containing the economic shock caused by the COVID19 induced panic, Bitcoin enthusiasts were quick to find yet another excuse to be all in, and justify their expectations, despite the downside move that started from 9950 a few weeks ago.
Since short sellers covered part of their positions at 3850 after margin calling everyone who was margin long on Earth, holders have regained confidence quickly and now expect bullish price action to come here, accepting this idea as Gospel and being quite vocal and emotional about it.
The fact so many expect this (together with the stock market to fall further) and the halving to be a bullish catalyst for Bitcoin I think the opposite is true and we will get a Bakkt 2.0 style event.
Once Bitcoin can't surge after the halving short sellers will push harder, and as prices slide on lack of demand, holders will start to panic and rush to send coins to exchanges, causing slow block times, until the next difficulty adjustment to come during June probably (1k blocks later), as miners turn off machines on the way down. The next logical support level in the long term chart resides at 1500 or nearby, which would make the bleeding stop just shy of filling the 'all time high retest' theorists' buy orders, leaving them eating dust as the market stages a furious come back rally.
If on the other hand prices glide sideways until then and then break over 7411.85 this scenario will be put in question. If valid we can get daily timeframe down trend signals to short it soon. My clients will be the first to know, when we can trade with good reward to risk and probability.
Cheers,
Ivan Labrie.

EURUSD: Massive top...I'm thinking the Euro is a huge short here. I'm short from a tad higher, but considering the reward to risk I think this is a very good trade to reccomend. Between 6 and 12 to 1 reward to risk ratio. Stop is 80 pips higher or so...Keep risk between 0.25% and 2% of your capital.
Target is hard to quantify, but it could be a long term top here since it was rejected at monthly resistance.
My guess is margin longs taken using Euro loans were sold, and this caused the recent rally in $EURUSD, in tandem with falling stocks.
Cheers,
Ivan Labrie.

DJI: Yearly trend analysisIn this chart you can see the signals we see in the yearly $DJI chart, using Time@Mode to process the data. This method has had great accuracy in all markets, a great way to analyze and trade trends in different assets. The stock market trend is up, despite what bears like to think, and there's still time left for the major trend cycle here to go into a consolidation period again. Due to fundamentals, price charts of stocks tend to trend upwards, so we only need to know when to be invested and when to remain on the sidelines. If we followed the consensus of analysts and the media, we would be in cash or in gold since 2009...Some food for thought.
What's interesting is to compare this to the trend signals in individual stocks, for instance, take $TSLA, it has a signal indicating it may rally until 2023, and reach a price as high as 5000 or close to it.
Another interesting thing is to try and adjust the $DJI to inflation, which at times helps explain inconsistencies in certain chart signals time duration (I've observed this in $TRV for example, if we don't adjust it to inflation, long term trend duration is a bit off).
It's good to verify both charts to be safe.
Here's the inflation adjusted chart:
In this case the bull market duration is a bit longer in the yearly.
The 2 month timeframe works well for mid term swings, in both charts:
Props to @timwest who came up with this methodology to analyze market trends.
Cheers,
Ivan Labrie.

BTCUSD: Accumulate coins here...I think the landscape changed a bit, probably due to excess leverage that needed to be weeded out. It altered the shape of the long term chart, but overall, didn't change the fundamentals or long term technical potential the #Bitcoin chart has. Now that sentiment has fully reset, I believe buying gradually here will pay off. Unless price hits 2544 within 3 weeks or less, we probably saw the bottom retesting the accumulation level at 3800 ish. Note the vertical lines on chart, every time we had a big range down swing in the 2 Month timeframe, it was a bear trap, followed by a mid term to long term bottom so far...This time, we managed to get a 'Range expansion' move pointing down in that timeframe again.
This can lead to a rally towards 98k in the event of a squeeze over time.
My guess is miners stopped the fall covering their hedges, with maybe some help from spot buys from big long term traders. People are still in awe and expecting further downside it seems, in my case I was short from 9100 lately, covered at 8060 and reshorted 7411, to then finally cover at 4605 using futures. Interestingly $GBTC premium had evaporated at the low...and futures premium wiped out too.
I believe we will have more clarity within 3 to 5 weeks but overall am bullish on #BTCUSD long term, at these prices. Weekly downtrend signal target was hit (price briefly traded lower than it but then rebounded -see red box, target was 4605-). By June the sell pressure from this signal should be exhausted. A sideways range here would be logical, before moving higher, to then retest the 9950 level as the next target zone. If it manages to finally break above that zone, we may start trending and break the all time high finally...If not, market is sideways and in control of bears. Let's see how it evolves.
Cheers,
Ivan Labrie.

BTCUSD: We may have seen the bottom already...As you know, I was short #BTCUSD from the 9100 zone on last week's bounce. We covered that short near 8000 and speculated on a potential bottom at the strongest support level below 8363, which was the 7600-7700 zone. If price doesn't go below 7411.85, the existing 2 month timeframe trend signal will remain active, suggesting price will trend up from here if that's the case. Targets are 42k to 281k by August 2021 for that signal. Hence, the reward to risk at the bottom was tremendous...
In the event of price not hitting 4605 by June, the weekly downtrend signal will have failed. It can also fail if price breaks over 9950 before then, which would trigger a proportional swing but to the upside, which would take #BTCUSD to 21289.75 within 13 weeks since breaking up.
Overall, worth a shot to see if we get the bottom right here. Daily charts will give us other tradeable signals soon, if we did bottom. So there's many interesting opportunities coming. My signals service clients will receive all the tradeable setups on a real time basis, if interested in trying the service free of charge for one month message me.
Cheers,
Ivan Labrie.

USOIL: Oil likely bottomed with stocks already...Monthly oil had flashed a downtrend signal recently, and appears to have bottomed after moving past target #1 and almost 70% of the range of the 2nd target. Sentiment peaked in all markets, stocks and oil, and BTC, I think we may have seen the worst of the decline already. Interestingly, people are now changing their mind regarding stocks and crypto, hearing many say they want to sell rallies...that is typical of market bottoms before trending up again.
Cheers,
Ivan Labrie.

Bitcoin: Longer term uptrend can still be in control...I'm out of hedges, and looking at price action closely. I do like that leveraged longs closed on the way down and are still reducing here. Shorts went to cash -big traders were most likely hedged, and are now increasing shorts gradually again, at Bitfinex. The long positioning was very extreme, and given the drop and margin calls, is likely resolved, as far as risks go. We have to follow the money, clearly liquidity being drained from global assets accross the board affected #BTCUSD and helped bears get out of bad shorts in profit adding to shorts into weakness.
With that out of the way, longer term upside might resume, following equities. Global coronavirus cases are now trending down after peaking last week. I will bet on the world not ending here...
Cheers,
Ivan Labrie.
BTC CME Futures: Downtrend until after the halving...This will be an unpopular chart but wanted to share my CME futures analysis as well. This chart has proved to be remarkably useful since inception of CME futures. Currently the weekly signal indicates prices will be under pressure for 11 more weeks after this one ends. Downside target might fail to be hit (4544.59), if it is reached, then it would be a tremendously good long entry but odds are low, since we have strong support at 7600 that might stop the fall, and we can't yet predict the 6445 level being breached.
Cheers,
Ivan Labrie.
