BTCUSD analysis for this cycle TopBTCUSD analysis for this cycle Top
1. According to the Elliot wave it is the 5th wave of elliot theory
2. As per the time cycles Btc should define the top in the last quarter of this year possibility in (oct or nov)
3. And for the projection as always the Btc favourite patthen AB=CB is also in play.
4. Fib extension tool level 1.618
So as we can see if btc will play according to this analysis. As its always follows this same things again & again in all cycle. So we can expect the top somewhere around (165,000).
Timecycles

The Canadian Dollar Index CXY on 1WEEK timeframe with cycles. Just a coincidence, I'm sure... But Canada's current Prime Minister just resigned exactly at the end of the 3rd cycle on a 9 year major support level. Is the Canadian dollar about to reverse? Pay attention to Canadian news over the next 6 months to support this idea.

BTC time cycle analysis for the next cycle topBTC time cycle analysis for the next cycle top
1. Blue line is the time period in which the previous cycle top breaks ( appox 1050 days )
2. Red line is the time period in which btc make a new top after that breakout ( appox 350 days )
3. White line is the time period of the cycle low to the top ( appox 1010 to 1060 days )
4. Yellow line is the time period after the halving btc defines the top ( appox 525 days )
5. Fib extension tool level 1.618
6. AB=CD pathern
As we can see history repeats itself btc is following this time cycle analysis over the past cycles, So if the history repeats again we can expect the level of (110,000)

Gann Astro Trading Course | Gann Trading StrategyGann Astro Trading Course | Free Lesson. Gann Astro Trading | Gann Time Cycles | Gann Financial Astrology. Gann Trading Strategy - Gann Trading Course
TOPIC OF THIS VIDEO - Gann Astro Trading Course | Free Lesson
🎯 Unlock the Market’s Hidden Code with W.D. Gann’s Strategies!
What if market movements weren’t random — but followed a precise, predictable blueprint? In this powerful breakdown, we dive into the groundbreaking methods of W.D. Gann, revealing how price, time, and planetary positions create a hidden pattern behind market highs and lows.
Gann’s revolutionary idea was that time and price vibrate together — making them interchangeable. By converting prices into planetary longitudes, tracking time cycles, and applying market geometry, you can uncover the market’s natural rhythm and predict turning points with remarkable accuracy. This video unveils the core of Gann’s strategy, giving you the tools to anticipate price moves before they happen.
---------------------------------------------------------------------------------------------------------------------
📌 What You’ll Learn in This Video:
✅Gann Square of 9 Explained – Understand how this iconic tool aligns price and time with planetary degrees to identify key turning points.
✅Price to Longitude Conversion – Learn how to convert market prices into planetary longitudes to uncover hidden reversal points.
✅ Time and Price Interchangeability – Discover how Gann’s theory of time-price equality helps predict trend shifts.
✅ The 10% Decimal Shift Rule – A powerful trick to reveal harmonic price levels by shifting the decimal point.
✅ Market Geometry: The Blueprint of Price Movements – Explore Gann’s geometric approach using circles, squares, and hexagons to map market pivots.
✅ Planetary Cycles and Longitudes – See how planetary movements — like Saturn’s retrograde and Mars' heliocentric positions — influence price action.
✅ Harmonic Degrees and Price Reactions – Find out why 10, 15, and other degree increments often mark critical spike reversal areas.
✅ Equilibrium Principle – Learn how Gann's "squared out" price and time cycles lead to powerful reversal setups.
✅ Real Case Studies: Tesla & IBM Analysis – Watch Gann’s techniques in action as we analyze historical charts to uncover price pivots and reversal dates.
market geometry and harmonic degrees.

Time the Markets Like W.D. Gann Using Planetary & Lunar Cycles! Unlock the Secrets of W.D. Gann’s Trading Method!
Is it possible to predict market movements using astrological cycles, planetary longitudes, and time-price harmonics? In this in-depth video, we explore how W.D. Gann’s trading strategies used the Square of 9, time cycles, and astro cycles to anticipate market highs and lows with incredible accuracy.
Gann believed that “time and price are equal”, meaning that markets move in predictable mathematical and astrological cycles rather than randomly. We’ll show real examples from Soybeans, Tesla, and Amazon, demonstrating how Gann’s time cycles trading strategy can be applied to today’s financial markets.
What You’ll Learn in This Video:
✔ Gann Square of 9 & Price-Time Convergence – How market prices align with planetary degrees
✔ Astro Trading Strategy – Using planetary longitudes, planetary aspects, and alignments for trade timing
✔ Gann’s Time Cycles Trading Strategy – Identifying reversal dates using time and price calculations
✔ Gann Cosmogram Strategy – How to use the cosmogram for timing major market moves
✔ Price & Longitude Equivalence – Understanding why certain prices act as natural support/resistance
✔ Astro Time Cycles & Harmonics – Discovering how planetary angles influence market trends
✔ Gann's Square of 144 & Other Geometric Forecasting Tools – Using squares and angles for market predictions
✔ The Role of Numerology in Gann Trading – How numbers relate to market movements
✔ How to Apply Gann’s Techniques in Forex, Stocks & Commodities
Why This Video Is Important for Traders:
- Learn how to predict market reversals instead of reacting to them.
- Gain insights into historical price movements and time cycles.
- Improve your technical analysis skills with Gann's mathematical and astrological approach.
- Understand why markets reverse at specific dates and price levels.
- Apply astro trading strategies and planetary cycles to your trades for better accuracy.
This is one of the most detailed explanations of Gann’s astro-trading methods, so make sure to watch until the end! Whether you're a Gann enthusiast, forex trader, stock market investor, or commodities trader, this video will give you actionable insights into how to use Gann’s techniques for trading success.

Gann Reversals: 144-225 Time Cycle & Fibonacci StrategyMastering Gann Market Reversals The 144 - 225 Time & Gann Price Cycle + Fibonacci Trading Strategy.
We dive deep into a powerful trading strategy that combines Gann’s 144-225 time and price cycles with Fibonacci retracement levels to predict market reversals with high accuracy. We explore how to identify key turning points, confirm entries using price action, and develop a well-planned exit strategy to maximize profits.
Whether you're a beginner or an experienced trader, this method will provide you with a structured approach to understanding price movements and timing your trades more effectively. Apply these principles to your trading routine and start seeing improvements in your decision-making and trade execution.
Learn how to master Gann market reversals using the 144-225 time cycle and Gann price synchronization, combined with Fibonacci trading strategies. This powerful approach helps traders identify key turning points, align time and price for precision entries, and enhance market predictions with Fibonacci confluence.

Gann Time Cycles Strategy: How To Predict Market Highs & Lows ?Gann Time Cycles Strategy: Predict Market Highs & Lows with Precision.
Mastering Gann Time Cycles: The Key to Predicting Market Highs & Lows
In this Gann trading strategy on time cycles, we explore a powerful method to predict market highs, lows, and reversals with precision. Gann’s theory is based on the principle that time governs market movements and that price action follows a structured mathematical cycle. By understanding and applying Gann Time Cycles, traders can identify key turning points well in advance, giving them a significant edge in the market.
The Importance of Time in Market Movements
W.D. Gann famously stated that "Time is more important than price. When the time is up, the market will reverse based on time." This means that while price levels are crucial, it is the time factor that ultimately determines when the market will make a major move. By analyzing Gann’s time cycles, we can predict periods where a reversal or a strong trend continuation is likely to occur.
📌 Timestamps: Gann Time-Price Squares: The Secret to Predicting Market Highs & Lows
00:00 ▶️ Introduction.
00:25 ▶️ Risk Disclaimer.
01:30 ▶️ What is Gann Time and Price Square.
02:10 ▶️ Key Numbers in Gann's Method
03:10 ▶️ Constructing Time and Price Squares
04:19 ▶️ Step 1 - Identify a Major Swing High or Low
05:18 ▶️ Step 2 - Apply Gann’s Time Cycles
05:39 ▶️ Step 3 - Draw a Gann Square
06:15 ▶️ Step 4 - Look for Price Reactions at Time Point
06:45 ▶️ Step 5 - Use Gann Angles for Confirmation
07:20 ▶️ Step 6 - Confirm with Market Behavior
07:50 ▶️ Step 7 - Set Entry, Stop-Loss, and Take Profit
08:30 ▶️ Gann Time-Price Squares: The Secret to Predicting Market Highs & Lows | Example - 1
14:00 ▶️ Gann Time-Price Squares: The Secret to Predicting Market Highs & Lows | Example - 2
16:50▶️ Conclusion & Key Takeaways
Applying Gann’s Time Cycles to Identify Market Turning Points
To successfully use this strategy, traders need to:
✅ Identify major swing highs and lows in the market
✅ Apply Gann’s time cycles to determine potential reversal points
✅ Use the Gann Square in TradingView to map key price levels
✅ Recognize time-price intersections to pinpoint entry opportunities
✅ Utilize Gann angles for additional confirmation
✅ Set proper entry points, stop-losses, and take-profits based on time predictions
By integrating these steps into your trading plan, you can improve your entry and exit accuracy and anticipate market movements before they happen.
Conclusion: Why Gann Time Cycles Are a Game-Changer
Gann’s Time Cycles provide traders with an advanced forecasting tool that allows them to anticipate market movements with greater precision. Unlike traditional technical indicators that rely on lagging price data, Gann’s method allows you to predict future reversals before they happen, giving you an edge over other traders.
If you apply this strategy correctly, you will begin to see the certainty within the randomness of the market. The key is to remain disciplined, test these time cycles on real charts, and refine your understanding through consistent practice.

Gann Time Cycles Price Synchronization | Gann’s Timing StrategyGann Time Cycles | Gann's Time Price Synchronization Method
In this video, we dive deep into the Gann Time-Price Synchronization Method, a powerful approach to market analysis that combines impulse moves, time cycles, and squared price levels. Learn how aligning price action with time-based cycles can help you identify high-probability trade setups and significantly improve your trading accuracy.
Key Points Covered:
- How to use Gann time cycles and price levels to anticipate market reactions.
- Step-by-step guide to entry criteria, stop-loss placement, and take-profit strategy.
- Practical application of the Gann method across Forex, stocks, and commodities.
- Enhancing trade confidence with market confirmation tools like candlestick patterns, RSI, and volume.
- Whether you’re a beginner or an experienced trader, this method will help you make more informed and confident trading decisions.
Trading Steps Overview- Gann Time Cycles | Gann's Time Price Synchronization Method.
1. Identify the Initial Impulse Move - Find the first strong price movement.
2. Identify Key Time Cycles - Use 144, 225, 52, 90, and 26-bar cycles.
3. Apply Price Squaring & Vibrations - Calculate squared price levels.
4. Look for Market Confirmation Confirm entries with price action and indicators.
📌 Timestamps: Gann's Time Price Synchronization Method | Gann Time Cycles
00:00 ▶️Gann's Time Price Synchronization Method - Introduction.
00:40 ▶️ Risk Disclaimer.
01:00 ▶️ What is the Gann Time-Price Synchronization Method.
02:18 ▶️ Gann's Time Price Synchronization Method - Core Principle.
02:52 ▶️ Step 1 - Identify the Initial Impulse Move
03:18 ▶️ Step 2 - Identify Key Gann Time Cycles.
03:50 ▶️ Step 3 - Apply Gann Price Squaring & Gann law of Vibrations.
04:10 ▶️ Step 4 - Look for Market Confirmation.
04:29 ▶️ Gann's Time Price Synchronization Method | Gann Time Cycles- Example.
10:49 ▶️ Gann's Time Price Synchronization Method | Gann Time Cycles- Trading Rules & Execution.
11:30 ▶️ Gann's Time Price Synchronization Method | Gann Time Cycles - Conclusion & Final Thoughts.

Understanding Gann Astro Trading.Understanding Gann Astro Trading: Why Time is More Important than Price
1.Time and Price are Interconnected:
- According to Gann, markets move in cycles, and these cycles are governed by natural and cosmic rhythms. The relationship between time and price is crucial, but time, as Gann states, is often the more significant factor.
- While price shows the movement, it is the time element that reveals the true potential of a market cycle. Gann's theory posits that price will ultimately follow time-based cycles, meaning that a specific time point will have a more profound influence on future price movements than price levels alone.
2.Time: The Key Driver of Market Movements:
- In his writings, Gann emphasizes the importance of specific time intervals, particularly geometric and astrological cycles, to predict price movements. Markets do not move in a vacuum; they respond to the inherent rhythms of time.
- As described in The Tunnel Thru the Air and How to Make Profits in Commodities, Gann believed that understanding time cycles could help traders forecast market turning points more accurately than focusing solely on price patterns.
3.The Significance of Degrees and Cycles:
- Gann used the concept of a "degree" to measure time in a circular manner. A degree represents a specific amount of time, where 360 degrees make a complete cycle. He applied this idea to market movements, showing how price and time could be mapped in a circular form.
- Gann believed everything in the universe operates in cycles—astrological, physical, and even economic. Through his Gann Wheel, Gann demonstrated how specific degrees, such as 90°, 180°, and 360°, corresponded to important market levels and time intervals.
4.Astrological Influence on Time and Price:
- Gann integrated astrology into his market analysis, acknowledging that planetary movements had a direct influence on market cycles. For example, a planet returning to the same degree it occupied at the start of a cycle could be a strong indicator of a market shift.
- By converting planetary positions into degrees and mapping them onto market time frames, Gann successfully predicted major market events.
5.Why Time is Critical:
- Gann's extensive research showed that market trends often form at specific time intervals—regardless of the price level—such as at 90, 180, 270, or 360 degrees from a key turning point.
-The timing of a market move can indicate a price reversal or continuation, and Gann believed that correctly identifying these time cycles allowed for more precise predictions.
-The market’s response to time cycles reveals the true potential of price movements, as price action will follow these natural time-based rhythms.
6.The Gann Square and Time Cycles:
-The Gann Square is another tool Gann used to analyse price and time. It is a geometric pattern based on the number 9, and each square corresponds to specific time and price relationships. By calculating the number of days or weeks that correspond with these squares, traders could better predict key market turning points.
- Gann’s approach suggests that once a market has completed a cycle of 360 degrees (time), the next cycle could follow a similar pattern, reinforcing the idea that time leads price.
7. Converting Everything to Degrees:
- Gann’s unique ability to convert price and time into degrees allowed him to identify specific turning points. Whether it was a stock chart, a commodity price, or even an astrological event, everything could be analysed using this degree-based methodology.
- In his Master Commodities Course and Gann Master Charts, he elaborated on how these degrees could be used for precise timing and decision-making in trading. Each market action and reaction could be mapped along a 360-degree circle, giving traders a unique insight into future movements.
--------------------------------------------------------------------------------------------
"Here is a trade example using the Gann Astro Trading Principle."
"Using Gann Astro techniques, I accurately calculated the exact reversal time for Gold 2 hours in advance. Although my limit orders didn’t get filled, the market reversed precisely at the predicted time, showcasing the precision of intraday trading with Gann Astro trading and mathematical Models"
OANDA:XAUUSD
TIME OF REVERSAL CALCULATED 2 HOURS PRIOR - In the market, TIME is more important than PRICE. Most of you are misled by retail strategies that solely focus on the X-axis (price), which is fundamentally flawed. Markets move based on the function of TIME, not price, and certainly not by your lagging indicators or ineffective strategies focused only on price. The real truth lies in the Y-axis: TIME.
TIME IS MORE IMPORTANT THAN PRICE - GANN
WHEN THE TIME IS UP THE MARKET WILL REVERSE- GANN
(Note: Emphasizes the precision of your calculation and method while acknowledging the limit order not being filled.)
"YOU DON'T PANIC WHEN YOU KNOW THE GAME"
------------------------------------------------------------------------------------------------
Conclusion: Time, as Gann stated, is often the more important element in forecasting price movements because it reflects the cosmic and cyclical influences that govern all aspects of life, including the markets. By converting everything to degrees, Gann was able to map time and price in a way that provided clearer insights into market direction. Through his works, we see that the true key to success in trading lies not just in price levels but in understanding the cycles of time that drive the markets.

Bitcoin Dominance Halving Cycles and Alt SeasonsThis chart shows that in the 2 recent halving cycles Bitcoin Dominance had a massive pullback 240 days after the halving. We are now approaching the next 240 day cycle after the most recent halving earlier this year.
240 Days after Halving = December 17 2024.

EURUSD: FUTURE PIVOT POINTSTry to catch these pivot points
TTT is here to predict TIME for you.
You can also follow us on Insta: TacTicTimeTraders

U.S. Dollar Index Upward Price Movement Until End of September?Here’s my analysis of the chart: I anticipate an upward movement in the U.S. Dollar Index until the end of September. Please note, this is based solely on time analysis, so the bar charts displayed do not predict future price levels.
The trade is still in its early stages, making it relatively low-risk. However, if the price falls below the current candle (first vertical line), this analysis will no longer be valid.
Let's see how it plays out, but be prepared to reassess if the price action invalidates the analysis.
SpaceIchimoku

Weekly Analysis Part 1- Daily/ Weekly Intraday US30, Gold, Forex
- Trendlines/ Circles
- RSI floors: 2nd, 3rd buy
- Time Cicles

BTCUSDT | A Small Upcoming Time Pivot!Between the 10th and 11th of January, I anticipate a pivotal movement in Bitcoin's trajectory. This analysis pertains to a smaller timeframe within a larger cycle. Please observe the linked chart.
Be prepared for a potential shift in the market around the 10th or 11th of January. The direction—bullish or bearish—will likely be influenced by the trend leading up to this timeframe.

DOW may DOWn from nowAs per Neo wave time cycle, Wave 'B' of the FLAT correction formed in DOW 30 index is ended today
since the recovery wave ABC extended nearly 76.8% of previous wave
expect a soft bear market cycle for 8 months from now.
trading is difficult as wave 'C' expands in 5,3,5,3,5 legs ,and expect a spike in VIX too
Do not hold your short positions for more days , as recovery waves will stretch more than 62%

Local Bitcoin time-analysisLocal Bitcoin View based on time analysis and price structure.
Based on the analysis of time, the main local (daily) pivot points on Bitcoin are:
Daily pivot Points: August 28 (08/28/2023) - today; September 6 (09/06/2023)
The local structure of Bitcoin is shaky, but it's not that bad. Today, the 28th of August is a very important day because it contains the daily pivot point. The next daily pivot point will be on September 6th. Given the presence of a reversal point today, it is important to watch a daily close very carefully.
Local Bitcoin Forecast: I believe the most expected move is to see the final short squeeze on Bitcoin before we are taken into a longer correction. However, given the presence of a daily pivot point today, there is no need to rush with longs, we are waiting for the daily close! It may turn out that today we will close the day with a sale which means we might get squeezed down to support before the next daily pivot point (September 6).
Opening Position:
Long: $24,800-$25,500 . Open in several limit orders!
Stop loss: $24,400
Bitcoin local targets:
Target 1: The minimum target for a short squeeze is the lower retest of the $28,300-$30,300 zone. 28K+- remains a zone about which there is distribution or accumulation!
Target 2: $32,800-$33,300. The bull structure is still not broken and the probability that the current markdown is a manipulation remains significant. I remind you from the previous analysis that we have a Weekly Swing Point on October 16 (16.10) until Bitcoin can easily make new highs.
Trade Plan:
(1) in the zone of $28,000-$29,000 we fix a part of the accumulated position!
(2) Stops are moved to breakeven!
(3) If after we squeeze into the zone, there will be consolidation for a couple of days - close the rest of the position!
(4) If we get above the zone and consolidate, we expect the second target: 32.8-33.3K!
X8 Crypto

BTC Potential Great Pump (DYOR)This is not financial advice! Do your own research!
Ranging cycle could be ended after 33 days from 24 Mar to 26 Apr.
And then we potentially come to the next cycle after that, around 45 days of bullish. Based on secondary progression.

XAUUSD H1 Potential Price VibrationXAUUSD Potential Vibration, H1 UTC+8, Start; 20 Apr '23 20:00, End; 25 Apr '23 02:00.
Range price from top to bottom around 330 pips (33 points). This is not the exact price & time movement, this is only a concept.
Disclaimer: Not financial advice!

Next target to $41.09 for Alphabet ?Here is my point of view about Google.
Based on my Elliott Wave, the bear trend could come back the next week (April,17) after the optimistic Bull run from March,13.
We reach the the Fibonacci Ret 0.382% and the ii circle degree seems to be done after a complex correction in ABCDE.
And about the Time the Ret and Projection both are pointing April, 6 and 10.
My concern now it's the indicator DT Oscillator who seem to be not ready for a reversal now.. so it's might be sideway to down the week of April,17 and wait 1 more week to be ready for a reversal during the week April,24.
If this post was useful to you, do not forget to like and comment.❤️ 🙏
Kindly,
TradingX30
Y.F


AAPL Time cycle analysis APPLETime cycle analysis and ramblings for the chart of Apple (AAPL), and what I think shorting and buying TIME regions may be.

WILL HISTORY REPEAT IN NIFTY???IN GIVEN CHART MARK 21st june 2022 we can see 2 doji and big up move similarly we can see that 2 doji this week 17 march ,so we can expect again big move .
* * ALSO I WANT ADD MORE POINT ON TIME FACTOR SEE 21ST JUNE WHICH IS EQUINOX AND 21 MARCH IS ALSO EQUINOX SO WE CAN MORE PROBABIILTY OF BOTTOMING,HOWEVER WE CAN NEGLECT THE BULLISH VIEW AS LAST WEEK LOW IS BREAK,THEN WE CAN BE BEARISH **

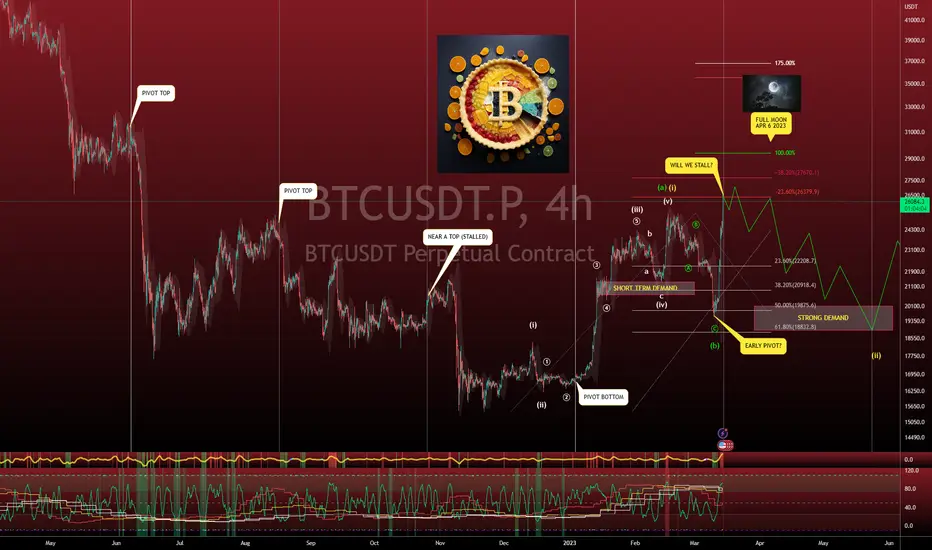
BITCON PIVOTS make a return (Happy Pi Day)Fred was a seasoned stock investor who had made his fair share of gains and losses in the market. But lately, he had been keeping a close eye on Bitcoin, convinced that the cryptocurrency was headed for higher prices. However, he was cautious about a potential move back to the $19,000 level, which was near the golden zone.
Despite his reservations, Fred couldn't help but feel optimistic about Bitcoin's recent performance. It had held well at the 50% area and was showing significant strength. However, he knew that momentum could stall in the time cycle window that they were entering.
As he monitored the market, Fred couldn't help but feel a sense of excitement and apprehension. He had a hunch that Bitcoin was on the brink of a major breakthrough, but he also knew that the market could be unpredictable.
Indicators are pointing to a move to roughly $27,000-$28,000 but depending on how long that takes, many indicators on higher timeframes will get to overbought status very quickly. The red wave has done a decent job of catching potential downside moves especially when we have gotten a sell signal. The last sell signal on the 4h timeframe on bitcoin was around February 16, 2023 and that resulted in a -20% move. The signs are early and I wouldn't make any harsh moves yet as things look incredibly strong but give it another week and we'll see where things are. Watch the red wave. If we pivot, we'd be creating some bearish divergence and if that plays out, then the green path seems likely to go to that golden zone by the end of May.
DON'T BE AFRAID TO TAKE SOME PROFIT OFF THE TABLE. Nobody survives in this market if you don't know how to manage your risk and take profits when necessary. The market can be generous and the market can be greedy.