Another EUR/USD turning point on 1H on 2021.05.06Here is another possible trend changing point for EUR/USD pair on 1H chart which will occur on 2021.05.06. It is most likely to occur around 14.30 EST in 15 min chart. Hourly bar is 14 EST bar.
Timecycles

EUR-USD - Time Cycle - Taito Suchi I did a flow-up on bullish scenario of EUR/USD on daily. There is a time cycle. It seems there is always 7 bars from high to the next high (Taito Suchi). The next high could be on the fourth of may. I also applied price theorie according to V, N and E calculations. In bullish scenario price could hit V, N OR E. Be aware that im still learning to master time and price theorie. So i could be wrong. Please correct or advise me.

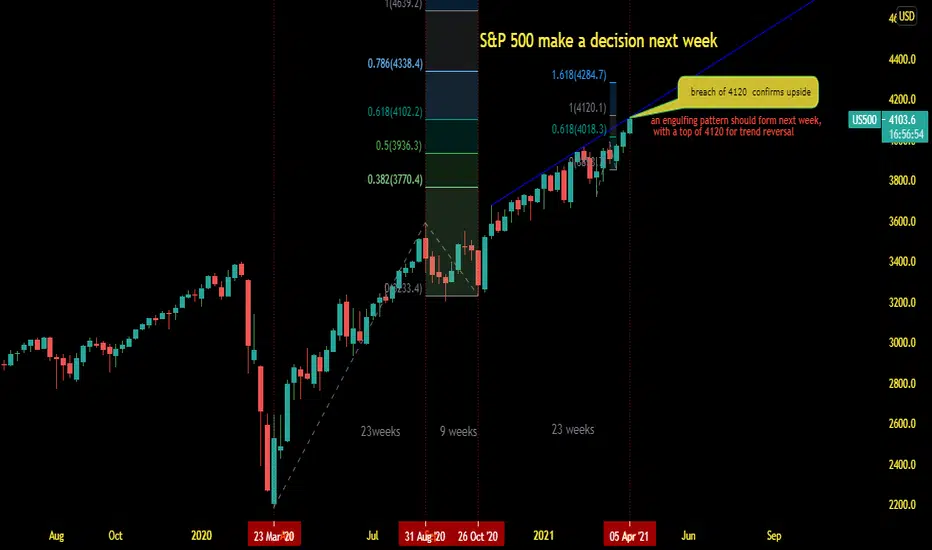
S&P 500 DECISION NEXT WEEKWe had 23 week BO and after a shallow 9 week flat correction , this index made another 23 week followup move northside.
So far every thing goes well with year low VIX. BUT something tells me that a big movement is gonna happen from next week.
Result season will punish the bulls? Neo wave time cycle has the clue. just wait for next week, dont forget to take a ticket for return journey
NZDUSD - Short term correction seems likelyIt seems like we might get a short term correction on NZDUSD
There is high odds for a correction if we get a close below the daily support trendline around 0.71115 (20.01.21). It might make sense to go short on a retest on the weekly resistance around 0.71550.
it looks like we have a bigger player building a short position and might be ready to finish up before he starts to move the market.
We could get as low as 0.68165 in one to two weeks time...
So it might make sense to go short on a retest on the new weekly resistance around 0.71550.


Bank nifty good short candidateBanknifty spot cmp around 24700
Time cycle maturing tomorrow around 2:15 time zone
Trend change possible,, if intraday high is not taken out after 2:15
can go short with stoploss of recent high for down side targets of 3 to 5%

Hero moto good short candidateHeromoto spot cmp 3365
Good positional short candidate
Inverted head and shoulder pattern formation..
Counter currently trading around resistance line of neckline and mid point of rising channel,,
RSI makind bearish divergence,,
Ever 150 trading session counter is changing it trend,, as per this 19 oct can be perfect trend change date
Counter can be short at current levels with stoploss of 3400 and hold for 10-15% down side targets...


Maruti good shorting candidateMaruti spot cmp 7150
Bearish bat pattern formation
PRZ range 7150 to 7230
view gets negated above 7350 on closing basis
down side 6900-6700-6500 possible

Reliance good short candidateReliance cmp 2318
Rising trend line resistance
counter gave breakout from cup and handle pattern with cup height of 735 points and after breakout today counter have completed up move of 735 points this might also mature the up move
price making higher high,, rsi making lower high bearish divergence.
from recent bottom of 867 counter took 85 days to reach previous peak levels means 735 points in 85 days
after breakout counter today completed its upmove of 735 points in 85 days , same price movement in same time..
Look for trend reversal in this area..

Tata steel good short candidateTata steel is clearly trading in falling channel pattern since last 15 months,,
currently counter is trading around resistance trend line of falling channel pattern
also counter is following perfect time cycle of 245 days
every 245 days counter tends to touch resistance line of falling channel pattern and again start it journey towards south,,
view gets negated once counter manage to give close above 460 levels

Time to accumulate OMG so you can say "omg" when it moonsIf the bull market prophecy comes true soon like every other post halvening rally, OMG should start a mission to the heavens later this year. Whichever direction the trend goes to around the pivot point is the macro trend untill the next pivot which could be a continuation or a reversal. I would bet the next pivot will be a massive rally upwards.

Time Precedes VolumesThis idea is based on the article Time Cycle Oscillators, published in IFTA Journal 2018.
As volumes precede prices, the “period of time cycles” precedes volumes.
Hence, the simple harmonic oscillator SHO (blue) is leading to the volume zone oscillator VZO. The latter is created by Walid Khalil.
Negative and positive divergences between the SHO and VZO help in predicting the direction of the VZO. Also, the SHO confirms and shows the significance of the signals which are generated by the VZO. i.e., the encircled sell signals on the chart.
Regards,
Akram El Sherbini

EOS is about to Moon6 pivot points in 3 years, we have recently entered the 6th point and this is the uptrend pivot we have been waiting for. Keep it simple.

Bajaj finance a conditional sell candidateBajaj finance :-
Darvax box consolidation are peak levels,
Rising Wedge pattern,,
Bearish harmonic Shark pattern fomation,
Bearish divergence on RSI indicator,,
50% Time and Price retracement,,
Breaking below 3190 which is support as per darvas box and also trend line support of rising wedge pattern,, and sustain would lead to fast and furious fall,, for 10-15-20%,, view gets negated above recent high on closing basis,,,

Bull or Bearish?
Bullish Perspective:
1. Bullish momentum
2. Higher Lows are being maintained
3. Overall trend still bullish
Bearish Perspective:
1. Price is near a bearish 10 d cycle closure
2. Key resistance and potential Stop Loss hunting
3. Price is more below if traded below @ 1720

GBP/USD about to CHANGE trend?Hey tradomaniacs,
GBP/USD is right now at a very crucial price-area and could either continue or change the trend.
LEAVE A LIKE AND A COMMENT - I appreciate every support! =)
Peace and good trades
Irasor
Wanna see more? Don`t forget to follow me.
Any questions? PM me. :-)


after break out trend line you can sell btc for 8850$I think market have a good condition for short position with ichimoku view and chart pattern
Safe trigger after trend line break out...

This silver time extension has reversed the trend every time!Every time silver has hit one of these 1:1 time extensions it has reversed the current trend it is in for a minimum of nearly a month. What will happen on this next extension? It is dated June 26 so we have time to prepare.

BTC: Geometry Analysis
Hi All,
I made a simple geometry approach to have an insight into the next move of BTC.
There is a very personal and professional reason for 33's angles. I can disclose it another day; this is not the post for it.
The analysis starts with time cycles in which we can see some prices consistently.
The converging points of the positive and negative angles displayed the next low and high prices. Here it is:
21 May 2020 $8661
14 Jun 2020 $9684
I do not pretend to give advice. This is just the result of hours thinking about it.

Bullish wedge formation34$ price target, stop loss 27$
TA x personal analysis = not investment advice
Best of Luck

Pressure Wave of SHO and WPZOBased upon
"Time Cycle Oscillators" published in IFTA journal 2018.
"Wave Period Zone Oscillator" published in IFTA Newsletter December, 2017.
Expected volatility after the SHI/SHO/WPO/WPZO forms a pressure wave (PW).
the volatility is higher when the PW is longer.
Akram
