GBP/JPY short opportunity Looking into this trade for early next week or end of next week using ichimoku waves , time theory and %R .
The waves are forming a first wave of 13 bars , the corrective also 13-1 bars. I expect most likely a third wave with 13 bars as well but could also stopped earlier at 9 bars before correction.
I'll look at bearish cross with %R , a bearish candle with a trigger. An extension up to the 161.1 level is also possible. Looking into a short opportunity with confirmation.
Timecycles

Blending SHO with WPZOSHO : Based upon Akram El Sherbini's article "Time Cycle Oscillators" published in IFTA journal 2018.
WPZO : Based upon Akram El Sherbini's article "Wave Period Zone Oscillator" published in IFTA Newsletter December, 2017.
Signals
The signals of the oscillators can be confirmed when the SHO/WPZO triggers a buy/sell signal, and the WPZO/SHO follows by a buy/sell signal in a relatively narrow time interval.
Whipsaws
The whipsaw generated by one oscillator only is insignificant. If both the SHO and WPZO generate whipsaws at the same time, then most likely it is significant.
Divergences
The agreement between the SHO and WPZO on positive/negative divergences makes them more considerable.
By Akram El Sherbini

#EUR_CADBreaking two neck lines and finally dealing with the support of 0.618 Fibonacci + candle stick patterns = long position Trigge
In this analysis, time levels are particularly relevant.....The horizontal lines represent the fibo-time-zones

Did Someone Say Pitchfork "Idea, Last Update, With Targets"Extra TA Described Below:
White Time Cycles (Half Circles):
To give relative index to, the time periods between, BTC's consolidation and growth
Black Sine Lines(Lines Intersection with Time Cycles From Bottom To Top Of Chart):
To show an index to "Growth Potential" of BTC during those Moments of consolidation/ growth (Sine is based on September lows/ highs of 2017)
White Inverse ABCDE Elliot wave (Marked A,B,C,D,E On The Chart):
If BTC can't break the channel upward after reaching ~11.8k Resistance Line
Black Elliot Impulse Wave (Marked 1,2,3,4,5 On The Chart):
Most likely going to see sideways movement for a long time from BTC.
If We Make Passed The ~11.8k Resistance Line Two Things Are To follow:
A tight squeeze up to ~13k Resistance line followed by large leap upward to ~17k- 18k Support Channel Resistance Line
Subsequently a large dump will commence (13k As it acted as such a strong resistance, in turn is now a strong support), Followed by a quick recovery/ Tight squeeze back up to ~20k ATH's
If you have questions feel free to ask.
NOT AN EXPERT DISCLAIMER
As Always DYOR and Good Luck.

Let's get freaky with Gann Box Analysis and Time CyclesI have decided to help make a more in-depth analysis covering CSE:LHS since the stock is fairly new. The chart above is where we are currently sitting, which is on the bear side of the gann box but we will get into that later.
How I start drawing Gann Boxes:
Use the dynamic Gann box tool and draw from high to low or low to high;
Configure the settings to show only 1 & 0.5, set all others to zero and turn angles on.
Things to remember about Gann's time cycles:
Days of interest and should be watched are significant days in a given solar year. Any of the solstices and equinox's (Dec 22, March 21, June 21, Sept 23) and their important angles which are in increments of 15 from these days. This means that 15 days after these significant days in a solar year.
Gann used degrees in a circle to compute cycle lengths. The 360 degree in a circle is approximately the same as 365 days in a year. So he used 180 (half a circle), 90 (a quarter of a circle), 45 (1/8 of a circle), 135 (90+35), etc.
He also used eights of 90 for shorter cycles to calculate the trading days in a cycle. 1/8 of 90 is 11.25 days, 2/8 is 22.50 days, 3/8 is 33.75 and 4/8 is 45 days. 5/8 is 56.25, 3/4 is 67.50, 7/8 is 78.75 and 8/8 is 90. If we round these numbers we trading day counts of 11, 22, 34, 45. 67, 79, 90.
Step 1:
Draw the first Gann Box from Low to High so an entry point can be established on the pullback.
Step 2:
Clone the Gann Box over to find entry once a support line is reached on one of the increasing angles about the 45 deg line. I use other indicators to confirm entries and exits. In the chart below we can see support is reached on Dec 13, 2017, but MACD hasn't come close to crossing. The actual breakout is on Dec 28, 2017, when we see strong RSI, Stoch crossover and MACD crossover to confirm entry. Oddly enough this date is shortly after the Winter Solstice which Gann says is a date to watch for. Digging further we see a high made when it reaches one of the trading cycle counts of 23 which is right after the 22nd degree.
Step 3:
The cycle has ended with The Box now broken and invalid since the creation of a new all-time high. We can expect an inflection point here and we can now redraw the Gann Box from the low to this new high. Oddly enough this Gann box has a cycle of 77 trading days and if we look above at the important dates we are pretty close to Gann's cycle.
As you can see we break the bottom of the box and again have to redraw the box to establish a new position if we can see movement onto the bull side of the box.
Step 4:
Since the creation of the new box and cloning the box over we can see a few things. We begin with the inflection upward along the strong trend line which is confirmed by rising RSI and Stoch crossover. However, this rally doesn't last since we soon break down into the bull side and consolidates until we reach a new ultimate low.
Step 5:
Since the Gann Box has become invalid once breaking through the bottom we can now redraw a new dynamic Gann box which end's up being our most current. From here we will analyze this one a little bit further.
We can see a few things after we create a new box. We have reached an inflection point where a rally starts moving and continues along the bull side of the box. An entry here is promising since the indicators are confirming a strong trend is imminent. Eventually, we break below the 45-degree angle and enter into the bear side where a trade would be closed.
If we look at this pullback we can see that it hits an area of support when we apply Fibonacci. We eventually break below the 1x1 angle but are able to make a nice gain should we choose to.
Present Day Look:
Pay attention to where the close is relative to the angles and what the indicators are telling us.
Looks like we are on the bear side of the box with a weak trend and the indicators do not look promising.
Well, that is it for me on this. Tell me what you guys think, don't be afraid to start a conversation with me if you have charts and ideas to share.

GOLD: Day-Swingtrade-Opportunity! #BuychanceHey tradomaniacs,
welcome to another free signal!
Important: Wait for the break above the marked up resistance and place a Buy-Stop or Buy-Limit!
-----------------------------
Type: Day-Swingtrade
Buy: 1288,39
Stop-Loss: 1283,20
Target 1: 1293,29
Target 2: 1295,55
Target 3: 1300
-----------------------------
LEAVE A LIKE AND A COMMENT - I appreciate every support! =)
Peace and good trades
Irasor
Wanna see more? Don`t forget to follow me.
Any questions? PM me. :-)

USD/CHF: Daytrade-Opportunity!Hey tradomaniacs,
welcome to another free signal!
Important: Wait for the retracement down to entry!
-----------------------------
Type: Daytrade
Sell: 1.00216
Stop-Loss: 1.00255
Target 1: 1.00102
Target 2: 1.00036
Targt 3: 0.99994
-----------------------------
LEAVE A LIKE AND A COMMENT - I appreciate every support! =)
Peace and good trades
Irasor
Wanna see more? Don`t forget to follow me.
Any questions? PM me. :-)

GOLD: Daytrade-Opportunity! Nice chance to SELL!Hey tradomaniacs,
welcome to another free signal!
Important: Wait for the breakout below support and place a sell-limit!
-----------------------------
Type: Daytrade
Sell-Limit: 1305,36
Stop-Loss: 1308,42
Target 1: 1302,28
Target 2: 1299
Target 3: 1297,22
-----------------------------
LEAVE A LIKE AND A COMMENT - I appreciate every support! =)
Peace and good trades
Irasor
Wanna see more? Don`t forget to follow me.
Any questions? PM me. :-)

BTCOIN and WHAT we NEED for a BULL-RUN!#OverviewHey cryptoheads,
welcome to antother analysis of Bitcoin.
In this chart we keep it very simple and look at the price-action, time-cycles and commin indicators.
All I want is to make sure that you guys don`t freak the hell out and buy the peaks.
Stay calm and rational in order to make good decisions.
In order to see a wealthy uptrend we need to see the folowing things:
1. S&R-Flips of Trendline and FAN.
2. A cross above the respected 50 M/A.
3. A strong bullish Time-Cycle
4. Higher Highs and Higher Lows
Everything else I wanna say is indicated in the chart.
Good Luck everyone. Let`s hope the King is Cryptomaniac has recovered. :-)
-----------------------------
LEAVE A LIKE AND A COMMENT - I appreciate every support! =)
Peace and good trades
Irasor
Wanna see more? Don`t forget to follow me.
Any questions? PM me. :-)

USD/JPY: Weekly overview! SOMETHING BIG is going to happen!Hey tradomaniacs,
welcome to another weekly overview of USD/JPY!
Everything I wanna say is shown in the chart!
The current picture is very bullish since we`ve created the first Trend-Following-Pattern in the big Time-Frame after a very strong rally!
I`ll post a chart of the smaller timeframe right below in the update-section soon!
-------------------------------------------------------------------------------------------------------------------------------------------------
LEAVE A LIKE AND A COMMENT - I appreciate every support! =)
Peace and good trades
Irasor
Wanna see more? Don`t forget to follow me.
Any questions? PM me. :-)

NASDAQ - NQ1! - Arcane Gann Wisdom The Full MapI share these Gann setup's quite often but people don't really seem to understand or have to knowledge what these geometry structures mean. Basically the Gann Square creates angles that reveal where value and time grow according to certain ratio's. The 45 degree Gann Angle is the most famous where value and time make a perfect 1:1 ratio, above this line value is dominant in momentum and below time is dominant. NASDAQ is currently hitting the 3/4 time target of the Gann Square and we see it's also hitting a resistance angle projected from ATH to the 50% price at 100% time values.
Try to study it, experiment, gann square can be really powerful!

AUDUSD Sell @ 73.1MONTHLY TREND: Sell
WEEKLY TREND: Sell
ALIGNMENT: Yes
2 DAYS BOLLINGER: Enter around 73.1
WAITING TIME: 8 DAYS (2DAYS X 4)
STOPLOSS: No Stop Loss close after 8 Days wherever
TAKE PROFIT: TP or wherever after 8 Days

January 2019 - Something is about to HAPPEN!#RocketShot inc.?Hey tradomaniacs,
Just a quick overview. :-)
uff.. what a hard time. But a good time to stack your Bitcoins?
Math don`t lie - We gonna reach the sky?
Will Bitcoin hold the Trendline? Or will we crash before big institutions are willing to buy and stack Bitcoins?
Will the King of Cryptomania last? Or is someone else about to take over the throne of the Bitcoin?
We will see. :-)
Peace and happy trading
Irasor
Trading2ez
Wanna see more? Don`t forget to follow me.
Any questions? PM me. :-)

DE30 Time cycle and technical.Let's start with the starting point in my analysis, at february 2016, where we had an increase of 49,15% of the price. this was a long term bull run, that continued until april 2017. afterwards the price started to react to the bull run, and wanted to make a correction, price failed to do so, and we got a new all time high, where we actually have been in a range market since then.
if you look closely the price have made a new higher high before falling again to support area at 12,000 ish. all the increases is marked with red boxes, and all of them have almost parallel factors, the first is 60 days long with an 7,98% increase of the price, where the second we have 58 Days with an increase of 12,31%, the third and last short term uptrend is 62 days, with a 12,64% increase of the price.
In the yellow boxes we have the first one with 78 days and a decrease of 8,19% of the price. The second yellow box we have 83 days and a decrease of 6,22% of the price. where the green box is 59 days with 13,86% decrease of the price.
The curves above price represent a H&S pattern, while the purple arrows is measuring the timeline for the formation of the shoulders and the head, where the right shoulder have just finished. The purple arrows actually predicted when the decrease in price was beginning.
So what can we expect from the technical view? the question is how far will it fall and when will it recover, either we can trust the purple arrows and expect the price to go back to 11,600 ish before going further for a all time high. Or we can look at the starting point from february 2016 and expect the price to fall as low as 9,000 -8,700. but before that happens we have strong support areas that the price needs to break. if the price should fall to 9000 - 8,700 than it needs to break 10,800.
other key levels will be, 12,200, 11,900, 11,450, 11,000, 10,800, 10,400, 10,000, 9,800
In RSI we also have hidden bearish divergence from the all time high to the latest high. This is a sign of weakness, and are often found during retracements in a downtrend.
And of course we have the fundamentals that is also needed to be taking in count. looking at the trade tensions, Eurozone economies, and Euro countries that is questioning the euro membership and the Euro as a single currency. besides that we have economies that needs to be watched closely, Greece, Italy, and Spain. Where quantitative easing program is ending sooner or later, while increase in the fund rate is expected around september 2019 for EU. all this factors is critical for the Germany index, and can be devastating for the price, if trade tensions and political uncertainty against Euro is not solved, we could se prices as low as 9000€

EURUSD (EURO) Big Picture: How Could This Possibly Happen???EURUSD (EURO) 042418 7:50 pm.
Hi trader friends, since this chart picture should replace a million words...
Either the EURUSD topped or it is in a lower degree 4th Wave triangle with only one more pop up to a top, then down for 4-18 months once the top is confirmed.
Whether its a triangle with one more high or the 5th Wave already top, is likely to be resolved this week.
I expect one more wave lower on the intra-day charts to touch the lower trend-line of what may be a triangle within 1-3 days.
Then, the EURUSD will likely bounce in a small corrective rally, meaning a huge down move is imminent.
Or, the bounce will have conviction and break the upper triangle resistance for one more impulse wave high, then tank into a Wave 2 low months or longer away.
After the Wave 2 low in likely 4-18 months from now, then somehow, the US Dollar will likely be in deep trouble as the EURUSD should have a substantial rally for several years, if this is correct..
DISCLOSURE:
This analysis is meant for educational purposes only. You trade at your own risk!
Michael Mansfield CIO

(ADA) TA looks good, but the fundamentals are even better!Alright folks we've got a nice double hitter today!
I always love when emerging chart patterns are coupled with trending news that confirm the analysis.
For those of you that dont know: Cardano just finished their first audit, and released the study highlighting a renewed concentration on bolstering the back end and stepping up their engineering efforts to the Cardano system.
It's no earth shattering game changer, but in a sea of pump and dump coins advancements like this are key to a projects longevity.
Alright, so you know the basics of the fundamentals driving my bullishness, now on to the TA!
Not currently relevant but this cardano trend shift is a great example of "patterns within patterns" as we can see from the two opposing angular minor double bottoms which form the major double (triple-ish) bottom.
We had a nice clean 5 wave elliot wave up.
The peak of the fifth wave up smacked the 100% retrace and failed to breakthrough.
Price also rebounded off 78% retrace, giving us a nice clear range to work within for breakouts.
Cup has been forming since March 21st, and its a very clean one, near perfect symmetry with a break at nearly the same price as the initial peak.
We finally got that EMA crossover everyones been looking for.
Approaching historical trend cycle point, overhead resistance, and 78% retrace.
There may be a bit of a struggle to over take the overhead resistance, but if we break out we could see a nice handle rally up towards the 127% extension.
True strength has been laying down new higher lows since March 30th, looking for a new swing within 24 hours.
As we can see from the OBV, volume is still at a major high.
The stochastic RSI of the volume however is consolidating down near the twenty line. Paired with the volume stabilizing at a new high level this is very promising.
Plan of attack:
Look for new TSI swing low
Ladder in from .20 to .2225
Stop loss at .21 after 100% retrace break out.
laddered exit around 127% or 168% retrace depending on trends strength when that level is reached.
This analysis is meant for purely educational purposes, and whether you choose to trade on it or not is entirely on you!
Good luck and happy trading fellow cryptoheads!
Austin Doyle
CTO

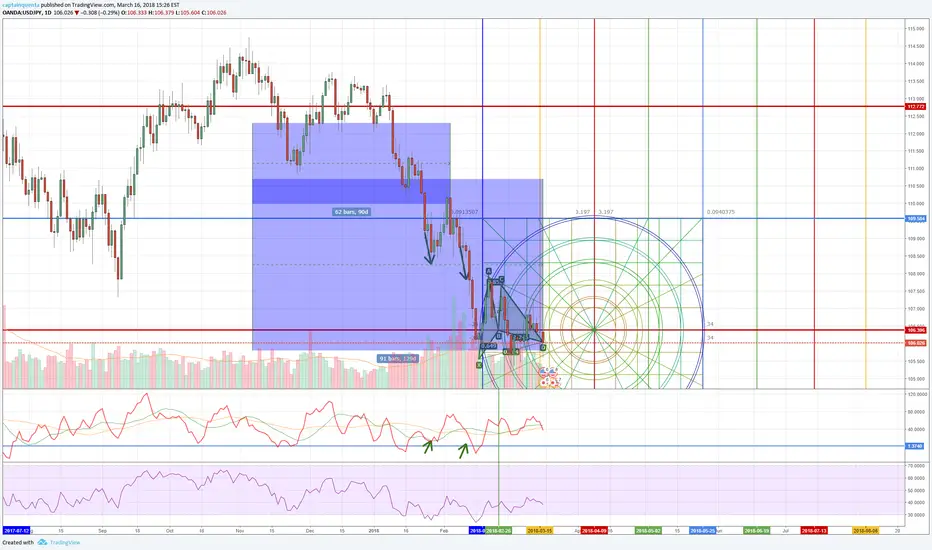
USDJPY long, target 120On the weekly, the CMI is going from oversold conditions and trending higher, daily shows an inverse head and shoulders pattern. Daily also shows a bullish Gartley completed nearly exactly on the close of Friday.
Pivot in time coincides with a culmination of a series of time cycles in Gann’s theories. Moon phase should be a moot condition due to the downtrend.
Friday closes within a few days of 135 day of Ganns 135 count. The behavior of this cycle is that if a swing high was found 45 days ago (which was 90 days from the major swing), then we are also 45 days from the high made at the 90day mark. Fast trend moves can start.