XAU/USD Setup According To Middle East EscalationHello Friends.
Im back with a broad perspective on GOLD.
According to happening these days in Middle East
(Hamas Terrorists against Israeil war) there are a perfect
catalyst for Gold to See Upper levels.
Lets take a look at Multi timeframe charts:
1)Daily chart
In 1D chart we can see a bearish trendline that price will see it again in coming days.
Here is where MAs meet each other (200 and 100 MAs are more important) and also there is
a strong resistance level there (1900 level).
after fall into 1800 - 1810 support level we saw a Strong Demand in Gold market
and price started to rise with a Bullish Engulfing pattern occurs in this level.
You can see my explanation in chart below :
2)Elliot Wave Count (15m Timeframe)
When we look at Gold Elliotly (:D) we can see a 5wave impulsive wave being completed as
1st wave of an upper degree Wave.
So you can see my wave count in chart below and due to Market Catalyst the correction wave
Supports at 23.6% Fibo level.
3)15m Price Action
As you can see in my main chart , near the 1800 support level , a Trading range shaped
and we see a strong Breakout after the News abot war.
This made a Spike phase (With an UP GAP at market opening).
Now we passed spike and go throgh an increasing channel.
Whats more is that we saw a Bullish Divergence between Price action and RSI.
Finally , I think Gold going to be bullish in cimig days and at least reach the 1900 level.
I hope you enjoy my idea.
PLZ share your opinion with me in comments.
Thank you ALL
#Worldpeace
Timeframe

Learn What Time Frame to Trade
If you just started trading, you are probably wondering how to choose a trading time frame . In the today's post, I will go through the common time frames , and explain when to apply them.
1m; 5m, 15m Time Frames
These 4 t.f's are very rapid and are primarily applied by scalpers.
If your goal is to catch quick ebbs and flows within a trading session, that is a perfect selection for you.
30m, 1H Time Frame
These 2 are perfectly suited for day traders.
Executing the analysis and opening the trades on these time frames,
you will be able to catch the moves within a trading day.
4h, Daily Time Frames
These time frames are relatively slow.
They are mostly applied by swing traders, who aim to trade the moves that last from several days to several weeks.
Weekly, Monthly Time Frames
These time frames reveal long-term historical perspective and are mostly used by investors and position traders.
If your goal is to look for buy & hold assets, these time frames will help you to make a reasonable decision.
📝When you are choosing a time frame to trade, consider the following factors :
1️⃣ - Time Availability
How much time daily/weekly are you able to sacrifice on trading?
Remember a simple rule: lower is the time frame, more time it requires for management.
2️⃣ - Risk Tolerance
Smaller time frames usually involve higher risk,
while longer-term time frames are considered to be more conservative and stable.
3️⃣ - Your Trading Goals
If you are planning to benefit from short term price fluctuations you should concentrate your attention on lower time frames,
while investing and long-term capital accumulation suite for higher time frames.
Time frame selection is nuanced and a complex topic. However, I believe that these simple rules and factors will help you to correctly choose the one for you.
❤️Please, support my work with like, thank you!❤️

AUDJPY: Could GDP Release change the trend?Hello traders,
AUDJPY Is going upward.
Our main Scenario is the long one:
Long Scenarios:
After breaking 95.050, We'll wait for a retracement.
TPs are: 95.650, 96.600
SL: below 94.700
Short Scenario will be published in case of breaking the upper trend-line.
Pivot points, Support and Resistance and also Sentiment data were used for this analysis.

EURUSD: More bearish daysNOTE: EUR CPI and FED interest rate decision may change market direction and devaluate this setup.
There are more sellers joining the market.
two entry points and and two TPs are clear in the chart.

Patience: How Higher Time Frames Can Save You from False SignalsHello TradingView Community! I know it's been a little bit since we have posted any content, but we are back after a brief hiatus to bring you more in-depth trading education! Today we want to cover a topic that we consistently see when helping traders who are trying to improve their results. That topic involves patience and leveraging time frames to improve your entries and chances for successful trades.
In the fast-paced world of trading, it's easy to get caught up in the excitement of chasing quick profits, almost every trader has done it. However, successful traders understand the value of patience and the importance of using higher time frames to avoid false signals. Today we are going to broadly cover how incorporating higher time frames into your strategy can improve your long-term results.
The Power of Higher Time Frames: Unveiling the Big Picture
By zooming out and analyzing higher time frames, traders gain a broader perspective on market trends and patterns. This allows them to identify major support and resistance levels, significant price movements, and long-term trends that may be invisible on a shorter time frame. Understanding the big picture helps traders avoid getting trapped in false signals and make more accurate predictions.
Avoiding False Signals: The Benefits of Confirmation on Higher Time Frames:
One of the biggest challenges traders face is distinguishing actual market signals from noise. By patiently waiting for confirmations on higher time frames, traders can filter out the false signals that often plague shorter time frames.
In this reversal example on the 15-minute time frame, it is nearly impossible to ascertain where an entry might be. If we zoom out several time frames, we get a much better idea of a possible entry signal that has taken days to develop.
Trading with higher time frames allows you to filter out false signals and make more informed trading decisions. Don’t get me wrong, lower time frames have their place in the trading world. However, they should be complemented with an analysis of higher time frames to obtain a better understanding of market conditions. Traders can use higher time frames to get their broader entry signal and fine-tune that entry with lower time frames. A well-timed trade can make a world of difference in your profits or losses.
Developing Patience in Trading:
Trading with higher time frames requires patience and discipline. It helps you overcome the urge to make impulsive trades based on short-term fluctuations. Here are some broad examples of how you can develop patience in trading:
Set longer-term goals: Instead of focusing on daily or weekly gains, set goals based on monthly or yearly returns. This shift in perspective allows you to take a more patient approach and avoid getting swayed by short-term market movements.
Practice delayed gratification: Instead of constantly checking your trades and obsessing over every small price movement, take a step back and give your trades more time to develop. Adopting a "set it and forget it" mindset can help you avoid making premature decisions based on short-term fluctuations. If you are constantly monitoring low time frame price fluctuations you risk getting analysis paralysis, which can lead to impulsive decisions that may negatively impact your mindset and your hard-earned money.
Adopting a systematic approach: Developing a trading plan or strategy that outlines clear entry and exit criteria can help traders maintain discipline and patience. By following a systematic approach, traders can avoid impulsive decisions and stick to their predetermined rules, which ultimately leads to better trading outcomes. A well-developed systematic approach often naturally forces our hand to be patient and lets the price action play out.
Practice self-reflection: Take the time to analyze your trading decisions and outcomes. Look for patterns, identify areas where impatience may have led to poor choices, and learn from your mistakes. By reflecting on your trading journey, you can gain valuable insights and make adjustments to improve your patience in future trades. A very undervalued way to accomplish this is to maintain a trading journal. We highly recommend keeping even a basic trading journal for anyone we work with.
Conclusion:
Trading with patience and using higher time frames is a proven strategy for avoiding false signals and improving trading accuracy. By taking the time to analyze the big picture, patiently waiting for confirmations, and blending different time frames, traders can make better decisions and increase their chances of success. Remember, in the world of trading, patience truly is a virtue.

Wait for a break! AUDCHF Hello traders,
Long-Term trend is bearish.
Mid-term trend is bullish.
A short-term correction and may be change in trend may happen.
Enter only after breaking the 0.5707
Middle of the bearish channel could work here!

High vs Low in Time-frame Decisions🕒🚀🕒 Big Timeframes: Imagine looking at a painting from a distance – that's the essence of big timeframes. Daily, weekly, and monthly charts offer a broader view of an asset's performance over extended periods. They help you identify long-term trends and major price movements.
📊 Small Timeframes: Now, picture examining a single brushstroke – that's small timeframes. Hourly and minute charts provide granular details of short-term price action. They're useful for spotting quick trading opportunities and assessing market sentiment in the moment.
💡 Investment Approach: When it comes to investing, consider your goals and risk tolerance. Big timeframes are great for long-term investors who prioritize stability and are willing to ride out market fluctuations. Small timeframes suit traders looking to capitalize on short-term price movements.
🚀 Finding Balance: There's no one-size-fits-all answer. Many investors use a combination of both big and small timeframes. Large timeframes provide context, while small timeframes offer insights into entry and exit points.
So, what's the takeaway from this timeframe comparison? 📈 It's about understanding that different timeframes offer unique insights. Whether you're a patient investor or an active trader, the key is to align your timeframe with your investment strategy.
Stay curious, stay adaptable, and remember – the art of investing involves choosing the canvas that best suits your artistic vision! 🎨🚀

EURUSD: Weekly overviewRegarding our observations, currently there are more buyers in the market
Long-term trend is bullish!
There is a bearish move that has started from JUL 18 inside the bullish channel so we could consider the mid-term trend as bearish.
There might be a short-term bullish move that we could make profit out of it.
1.0820 and the bottom of bullish channgel are proper prices to place long limit orders.
1.0950 and 1.1028 are best places to set short limit orders.
These are best levels regarding Support and resistance, Channels, Weekly pivots, Buyers and Sellers focus and order_block.

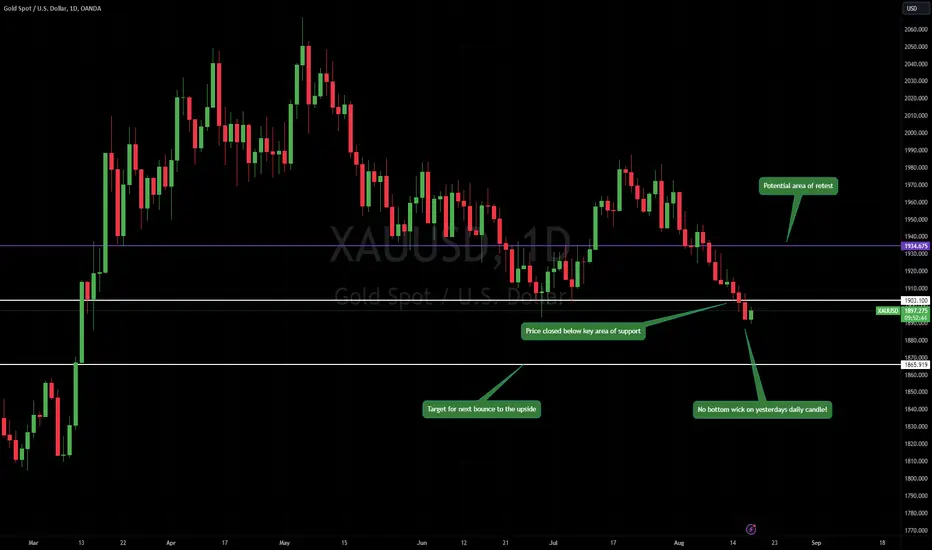
XAUUSD Gold daily breakdownI have returned from my travels, apologies for the lack of ideas over the past 24 hours!
Gold closed below the key support area of 1903 on Tuesday, and wednesday saw the expected reaction of price continuing down especially with FOMC minutes adding to the move.
What can we expect from here? To keep it brief, on a daily timeframe I'm expecting 1965 to be tapped as a liquidity grab, if we see todays Daily candle flip from bullish to bearish there is a high probability we push down towards end of August.
Key thing to note - The monthly still has no top wick! That is a lot of liquidity left to grab at the 1980 area however, to see the monthly candle push 80+ pips and then flip would take a lot of momentum so whilst it's unlikely to happen in September, it's something to bear in mind if you are bullish.
AUDCADCurrently there are absolutely more buyers in the market
AUDCAD is bearish! But we are around a very important level and bottom of bearish channel
These are best levels regarding Support and resistance, Channels, Weekly pivots, Buyers and Sellers focus and order_block.
Save some profits in each static and dynamic level.

GOLD: What we are going to do in this week!Gold is bearish! But it is around a reaction leve, We could expect a correction for the first days of this week!
There is high probability of retrace back to main trend around 1935.
TP's might be weekly camarilla resistance levels , 1921 and 1912.
Our final TP is overlapping of middle of bearish channel and HTF bullish Order_block!
Best regards, Alisignals

Short CHF! LONG: ???CHFThe Swiss franc may use it's value in next days.
There is strong pressure in market for the currency. Mostly because of technical reasons. Rising pairs like CADCHF are much more probable here.
Just be a little more cautious about CADCHF! Cad is highly co-related to the oil!

USDCHF: 4H Chart:
Regarding HTF analysis USDCHF is bearish! However we are in an almost strong correction!
We expect a reverse from around 0.89000, but till to get there, considering intraweek tradings, the pair is bullish.
We wait for next week s1 to evaluate buying opportunities.

XAUUSD Daily breakdownPost FOMC and unemployment claims has finally given us the high volatility we've been waiting for. We saw price test 1980 before falling 40$ and closing below 1954 which was a strong level of resistance.
As far as the daily timeframe is concerned, we are in an area of indecision which means we could reject any support or resistance here at any level and just range like we did on the 24th May until the 20th June.
Alternatively, the market picks a direction and pushes straight through. What will be the catalyst for it? Well, We have PCE tomorrow (what people call the FED's favourite inflation indicator) and NFP next week. This is the perfect set-up for a push down.
Why down? Main reason is the weekly candle has flipped from being strong bullish to bearish. That is significant for price action, and all it takes from here is another $30 drop in price on Friday and Monday for the monthly candle to close bearish after testing the 1980 level, which for me would be the most obvious indicator that we will be visiting the low 1800's.
Thursday 27th was a great day for trading with 3 trades based on levels posted, and it was all from being patient.
As always, be patient, wait for the market to tell you what it is most likely to do next, and then act.
Feel free to request any charts in the comments below and let me know what you think!

EURUSD full weekly AnalysisSMA 20 of Daily chart alamost matches with SMA 480 of hourly chart.
SMA20 of daily chart was a great trend detector for the pair recently so I'll use 480 in hourlt chart.
According the SMA20 we are still bullish.
By deeper look at Daily chart a bullish channel could be seen that proves bullish trend. Also a great SNR zone is obviously clear in daily chart.
I think last week was just a correction.
By looking at 1H zone, we could see conflux of mighty SMA480, Camarilla pivot level of S3, Daily S&R zone and also a strong Delta Volume important zone.
There is a high probability of rejection from the zone.
About the delta volume: There were strong buyers in last bullish move, but in some points there were slightly stronger sellers, market tends to reverse from those critical points.
Looking at IG sentiment factor we'll get that sentiment indicators worked reversely in recent weeks. So strong sellers can not hesitate me.
Market may avoid sharp moves before FOMC meeting at Wednesday.
TP1 : 1.116
TP2 : 1.121
TP3 : 1.130

The importance of using different TimeframesWhen visualizing the market and conducting technical analysis, it is crucial to interpret different timeframes.
Multi-timeframe analysis can enhance the probability of success in our trading by utilizing support and resistance levels from higher timeframes than our base timeframe.
It is also useful for identifying candlestick patterns in other timeframes and assessing their alignment with other signals observed in our analysis.

Learn Why You Should Study Multiple Time Frame Analysis
In my daily posts, I quite frequently use multiple time frame analysis.
If you want to enhance your predictions and make more accurate decisions, this is the technique you need to master.
In the today's post, we will discuss the crucial importance of multiple time frames analysis in trading the financial markets.
1️⃣ Trading on a single time frame, you may miss the important key levels that can be recognized on other time frames.
Take a look at the chart above. Analyzing a daily time frame, we can spot a confirmed bullish breakout of a key daily resistance.
That looks like a perfect buying opportunity.
However, a weekly time frame analysis changes the entire picture, just a little bit above the daily resistance, there is a solid weekly resistance.
From such a perspective, buying GBPUSD looks very risky.
2️⃣ The market trend on higher and lower time frames can be absolutely different.
In the example above, Gold is trading in a bullish trend on a 4h time frame. It may appear for a newbie trader that buyers are dominating on the market. While a daily time frame analysis shows a completely different picture: the trend on a daily is bearish, and a bullish movement on a 4H is simply a local correctional move.
3️⃣ It may appear that the market has a big growth potential on one time frame while being heavily over-extended on other time frames.
Take a look at GBPJPY: on a weekly time frame, the market is trading in a strong bullish trend.
Checking a daily time frame, however, we can see that the bullish momentum is weakening: the double top pattern is formed and the market is consolidating.
The sentiment is even changing to a bearish once we analyze a 4H time frame. We can spot a rising wedge pattern there and its support breakout - very bearish signal.
4️⃣ Higher time frame analysis may help you to set a safe stop loss.
In the picture above, you can see that stop loss placement above a key daily resistance could help you to avoid stop hunting shorting the Dollar Index.
Analyzing the market solely on 1H time frame, stop loss would have been placed lower and the position would have closed in a loss.
Always check multiple time frame when you analyze the market.
It is highly recommendable to apply the combination of at least 2 time frames to make your trading safer and more accurate.
❤️Please, support my work with like, thank you!❤️

History will repeat? $182 or $110Monthly Chart
Binance Coin ( BINANCE:BNBUSDT ) is trading around $236 now.
It's dropped from $398.3 and in accumulating
Look back to the history. I see two drops on Jan 2018 and Jun 2019, both of them has the same percent are about 83.64% and 83.89%.
History usually repeats itself!
I wonder how's about this time?
Now, BNB/USDT in Descending Channel and it's support zones by Fib Channel (1.0) and last Swing Month Low $183.4
Supports can hold it and made it bounced back or Binance Coin will break down and drop to around $110.
Wait and see

🕰️ The 4 Pillars of Trading Timeframes🔷Scalping:
Scalping is a trading strategy that involves making multiple quick trades within a short time frame, typically holding positions for just a few minutes. Traders who employ this strategy are referred to as scalpers. The main objective of scalping is to capitalize on small price movements and accumulate small profits that can add up over time. When engaging in scalping, traders focus on short-term charts, such as 1m,5m,15m charts, to identify rapid price fluctuations. They often use technical analysis such as order flow and volume , to spot entry and exit points. The key is to identify highly liquid instruments with tight bid-ask spreads and sufficient volatility. Scalpers must closely monitor their trades and maintain discipline, as the rapid pace of trading can be mentally demanding. Risk management is crucial in scalping and it is advised towards experienced traders that backtest their strategy before taking on scalping.
🔷Day Trading:
Day trading involves executing trades within a single trading day, with all positions closed before the market closes. Day traders aim to profit from intraday price fluctuations and take advantage of short-term trends. This style of trading requires active participation and constant monitoring of the market. Day traders typically use charts with shorter time frames, such as 15m,1h,4h to identify patterns and trends.
🔷Swing Trading:
Swing trading is a medium-term trading strategy that aims to capture price movements over a few days to several weeks. Swing traders seek to profit from short-term price fluctuations within the context of a larger trend. This approach allows traders to participate in more significant market moves while avoiding the need for constant monitoring. Swing traders typically use 1H,5h or daily charts to identify potential trade setups. They focus on technical analysis tools, such as trendlines, chart patterns, and indicators like moving averages or the Relative Strength Index (RSI). The objective is to enter positions when there is a high probability of a trend reversal or continuation.
🔷Positional Trading:
Positional trading, also known as long-term trading or investing, involves holding positions for weeks, months, or even years. Position traders aim to capture larger market trends and ride significant price movements. They often base their decisions on fundamental analysis, considering factors like macroeconomic data, company financials, and market trends.
Position traders primarily use higher time frame charts, such as weekly or monthly charts, to identify long-term trends. They rely on fundamental indicators, news events, and market sentiment to make informed trading decisions.
👤 @QuantVue
📅 Daily Ideas about market update, psychology & indicators
❤️ If you appreciate our work, please like, comment and follow ❤️

GBPAUD: Bearish Forecast & Bearish Scenario
Our strategy, polished by years of trial and error has helped us identify what seems to be a great trading opportunity and we are here to share it with you as the time is ripe for us to buy GBPAUD .
❤️Please, support our work with like & comment!❤️

XRP Multi timeframe trend/stat this colors each show different powers
purple (strong) weekly
pink (major) daily
green (minor) 4hours
and each one can act differently in order to power and condition of price

Why You Need All Timeframes..Hey Guys,
As you may of seen earlier on my stream, we need to be using all Timeframes to be accurate when trading..
WHY? Well it's simple. Without them you are BLIND to the longer term market.
Short timeframes cater to SHORT TERM Trading. You cannot take long term trades or get a long term view of the market with short term timeframes.
So understand their true purpose and how to use them..
Watch for more.

EL - due for some rebound (bullish divergence)After a heaving sell off, EL appears to be finding support at the 78.6% fib retracement of it's major upswing AB (see mthly chart on Left).
Odds appear good that a rebound could be in the works as the bullish divergence seen on the daily chart spanning over the last few weeks is now supported by a mildly bullish divergence seen on the monthly chart as well.
I would consider to long upon the clearance of the last candle high @ 189 with a small stop loss about $1 below the recent low @ 182. Raise stop loss to breakeven as soon as it is able to clear 195 with a possible exit around $209.
Just a short term trading idea with 1 : 2.5 risk-reward ratio. Let's see if it works out!
Disclaimer: Just my 2 cents and not a trade advice. Kindly do your own due diligence and trade according to your own risk tolerance and don't forget that money management is important! Take care and Good Luck!
