TLMUSDT midterm Analysis (+240% potential from here)Hello friends.
Please support my work by clicking the LIKE button(If you liked).Thank you!
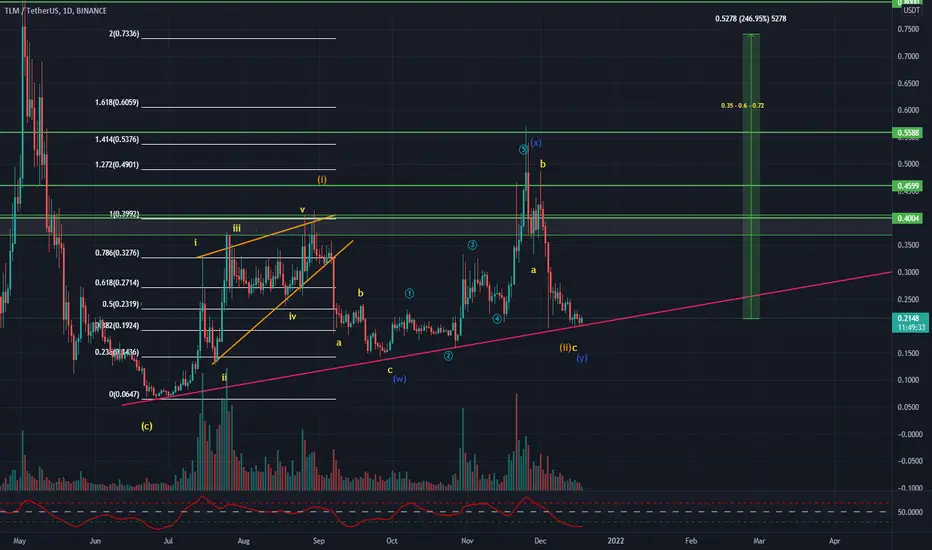
Everything on the chart.
open pos: market and lower
target: 0.35 - 0.6 - 0.72
after first target reached move ur stop to breakeven
cancellation of growth, consolidation below 0.1
stop: im w/o stop (depending of ur risk). ALWAYS follow ur RM .
risk is justified
Good luck everyone!
Follow me on TRADINGView, if you don't want to miss my next analysis or signals.
It's not financial advice.
Dont Forget, always make your own research before to trade my ideas!
TLMUSDT
TLMUSDT , TLM , TO THE MOON OR GOING DIP?Sharing my idea about TLM.
In my opinion if it doesn't breakdown under 0.1436 it's GOING to EXPLOID🚀.

TLMUSDT - 10 jan 2022TLM reaches a good zone that you can divide your entries within the green zone as shown, price down and low volume means it is a correction to grab some liquidity
our entries will be as shown on the chart or wait the breakout with confirmation
first 2 targets will be easily to reach, the other targets will take time

TLM Update Sharing my latest analysis on TLM coin , as you can see trendline acting as strong support , you car refer this to take your trades

TLM - BREAK OUT!!!Except for the June 2021 crash. TLM's support line did a great job of keeping the price above it.
Currently, the price has broken out from the downtrend so we can expect a beautiful scenario in the near future.
Short-term target: 0.27 - 0.33 - 0.37
I believe we will see this price soon!
Have a nice day!

TLM As long as it does not close above it is a death crossHello Traders,
This is so simply, we need prices close above the 200&50 MA or this will be a death cross.
If it is yellow zone imho good to buy some.
Thanks a lot! 🚀

TLMUSDTTLMUSDT trading volume star increasing.
Also whales buying activities were noticed.
Good entry point.
I will sale at 0.45 25% and 0.55 25%
BINANCE:TLMUSDT

TLM/USDT Perfect bearish retest and Now looks bearish or Bullish#TLM/USDT Overview:-
$TLM current Price = $0.210
Overall This is also Bearish in LTF and In 2D time frame we can see Bearish Retest already done and Rejected from Resistance 1.
Now..?
As per chart if S1 break then we can see best entry around $0.151
This will also Bullish Retest level so Best time to Enter in $TLM
If $TLM break 1st Red TL then it will enter in Bull zone.
In Long Term it can hit $5 also.
Targets = Resistance
Support: $0.20/$0.151

TLM ANALYSISI AM BULLISH IN THIS TRADE
NEED TO WATCH IT CAREFULLY
ALL DEPEND ON BTC MOVEMENT
Broadening top formation
stoploss at 0.1800$
target 0.2700$

BUY TLMUSDT @CMPBUY TLMUSDT @CMP base on basic support and resistance analysis.
TARGETS: 0.2361, 0.2550

tlm ✌️tlm soon pump
why?
It will soon hit the bottom of the canal and will continue its upward trend to the midline range.
Do not despair of it because it is so valuable
good luck✌️

TLMUSDT Aliens world 👉TLM
Since from my last analysis 32% up. Let's take some profit here. Long again in dip.

TLM - will history repeat itself?A wedge pattern is formed on the TLM chart. There was a similar scenario in November this year. In the event of a breakdown of the wedge, there could be a good buying opportunity. Last time after the breakdown of this pattern, there was a strong rally and the price went up by 120%. It will be interesting to see what happens this time.
Write in the comments all your questions and instruments analysis of which you want to see.
Friends, push the like button, write a comment, and share with your mates - that would be the best THANK YOU.
P.S. I personally will open entry if the price will show it according to my strategy.
Always make your analysis before a trade.

TLM - a falling wedge has formed on the chart!In the last idea, we marked the global picture on the TLM chart. And already then a descending wedge was forming. Now the pattern is still forming and the price is starting to squeeze near the upper boundary, which is a good signal - a signal for a breakdown!
In case of a breakdown or a retest of the upper boundary as support, there could be a good buying opportunity.
In the event of a false breakdown, close the trade and open a sell position.
Write in the comments all your questions and instruments analysis of which you want to see.
Friends, push the like button, write a comment, and share with your mates - that would be the best THANK YOU.
P.S. I personally will open entry if the price will show it according to my strategy.
Always make your analysis before a trade.

Is TLM going to skyrocket❓❓❓In the last idea, we said that a break of the upper boundary of the wedge could be a good buying opportunity.
After the breakout, the price has already risen by 30%, which is a very good result.
A key level and a local support level can now be identified on the chart. The price is squeezed between these two levels. On the technical analysis side, the trend has reversed and it is worth looking for entry points to buy.
In case of a squeeze and breakout of the key level, there could be a good buying opportunity.
Write in the comments all your questions and instruments analysis of which you want to see.
Friends, push the like button, write a comment, and share with your mates - that would be the best THANK YOU.
P.S. I personally will open entry if the price will show it according to my strategy.
Always make your analysis before a trade.

TLM is trying to breakup the important resistanceAccording to 3D chart TLM broke the wedge recently and have a strong buyers, who are pushing the price up these days at resistance level.
In my perception two scenarios might happen:
1- Price squeeze up at resistance level and after breakup retest it as support level.
2- Rejection from this level, have a correction and a few days later try to break the resistance.
I believe in first idea and the trend shows it can break it up easily. It's the beginning of very strong bullish.
TLM will touch the $1 soon.
--------------------------------------------------------------------------------------
P.S. This is not an advice to buy or sell, that's just an analysis that needs to considered too.
Always make your analysis before a trade.

long
I think in the range are the best places to returneth and breaking the range and continue the process is very important. This analysis is only for your better perspective


TLMwe have a huge resistance here in 0.233. Also its a PRZ zone in the purple circle. so its the nice gaming token for buy and HOLD .

TLM chart Here is my chart analysis on TLM coin (Aliens worlds) . Till now trendline is acting as a good support , once broken you expect the price to be around 0.13 and for quick trade 0.1550 can be good opportunity .

TLM- What a Bargain!What a bargain huh?
You can see my way?
What do you think?
Stay following
Thanks

⚡ TLM Looks Bullish!TLM Beak the Trendline but it could be a fake breakout we'll enter in the trade on 0.245 - 0.250 So we will book profit partially.

TLMUSDTHello Crypto Lovers,
Mars Signals team wishes you high profits.
We are in the 4-hour time frame. As you can see the price has gone below the first support line and now is trying to break that support line which is the resistance line now. If the price is able to break the resistance line and stabilize there, it can continue moving to the next resistance and have a good rise. We can draw a head-and-shoulder pattern here and if the price is able to move up to price 0.3114, the head-and-shoulder pattern will be completed and it will fall again. But if it is not able to break its first resistance line and stabilize there, we can expect a pullback and more falling for this currency.
Warning: This is just a suggestion and we do not guarantee profits. We advise you to analyze the chart before opening any positions.
Wish you luck
