THE WEEK AHEAD: CRON, TLRY, CGC EARNINGS; EWZ; VIXHIGH RANK/IMPLIED EARNINGS:
CRON (32/82) (Tuesday Before Open)
TLRY (50/97) (Tuesday After Close)
CSCO (44/27) (Tuesday After Close)
WMT (48/23) (Thursday Before Open)
NVDA (24/43) (Thursday After Close)
AMAT (17/34) (Thursday After Close)
CGC (95/87) (Thursday Before Open)
JC (30/43) (Friday Before Open)
Notes: Looks like it's the "Week of Weed" with CRON, TLRY, CGC announcing and all in states of high implied/high rank ... . If you're hesitant to go into single name here, MJ (47/51) has decent rank/implied metrics, although it's less liquid than I would like.
EXCHANGE-TRADED FUNDS:
TLT (56/12)
EWZ (47/28)
SLV (44/22)
GDXJ (37/31)
GLD (34/11)
EEM (33/16)
First Expiries In Which At-the-Money Short Straddle Pays >10% of Stock Price:
TLT: January of '21
EWZ: March: 5.64 verus 43.02 (13.11%)
SLV: April: 1.72 versus 15.70 (11.0%)
GDXJ: January: 3.99 versus 36.33 (11.0%)
GLD: January of '21
EEM: June: 4.97 versus 43.68 (11.4%)
Notes: Pictured here is an EWZ delta-neutral short strangle camped out at the 20 delta in the first expiry in which the at-the-money short straddle pays greater than 10% of the value of the underlying. Paying 1.61, it has break evens of 35.39/50.61 with delta/theta metrics of -.36/1.49; .40 at 25% maximum; .80 at 50%.
BROAD MARKET:
Broad market premium selling simply isn't paying here in short duration (an understatement).
FUTURES:
/6B (72/9)
/NG (74/60)
/SI (44/21)
/GC (34/12)
/ZS (32/20)
Notes: Natty is frisking up, which should be no surprise. Having put on a bullish assumption seasonality play in UNG way back in August at lows, I'm just waiting for things to top out in January or February before doing something in the other direction.
VIX/VIX DERIVATIVES:
Term structure trades* in VIX remain viable for the December, January, and February expiries with the correspondent futures contracts trading at 16.05, 17.33, and 18.07 respectively.
On the other end of the stick, continue to consider a VXX Super Bull or similar setup to potentially catch a modest volatility expansion running into the end of the year without sticking your entire pickle in the grinder, particularly if VIX continues to trundle along at 2019 lows: the December 20th 16P/-18P/18C/-20C pays a small credit (.17), has a 17.83 break even versus spot of 18.64, and max profit/max loss metrics of 2.17/1.87, with max being realized on a finish above 20, which does not exactly require a massive pop from here.
* -- Generally short call verticals with break even near where the correspondent /VX futures contract is trading (e.g., the December 20th 15/18, paying .90, with a 15.90 break even versus the December /VX contract trading at 16.05; the January 22nd 16/19, 1.00, with a 17.00 break even versus 17.33; February 19th 17/20, with an 18.00 break even versus 18.07).
TLRY

TILRAY - Major Bullish SignalsWeekly RSI bullish divergence plus break-out above the downtrend line. Still in the accumulative zone and previous week closed TD5 Downtrend and this week on TD1 Uptrend.
Moving Average Convergence Divergence (MACD) indicator also showing bullish divergence and crossed to bull mode. Overall this looks like a great entry and if it goes lower even better to scale in longterm.
It also appears to have completed 3 down waves in a falling wedge or downtrend channel.
Please like and comment if you agree or have a different view!
Good to go, happy trading.
-TheTrex


Tilray possible bottom formingWatching TLRY for high volume neckline break. I like the looks of it so far. Strong volume bullish engulfing off the low there caught my attention.

TLRY - TilrayClose to buy zone, also numerous bull divs present and appearing to be in minor last wave (1-5) plus in larger falling wedge. Would look for a buy now in upcoming week.

Another 25-30% drop before true bottom (TLRY)Here is my update on TLRY price action.
Previously, I thought $34-$35 was bottom but I did not pay close attention to the weekly RSI. Around 3 June 2019 the weekly RSI did not reach 30 levels or below. Last week RSI got much closer to 30 but I still need to see 1) lower RSI (somewhere below 30) or retesting 30. So, I expect to see a downward trend in price for the next 4-8 weeks and RSI retesting the 25-30 level again.
I think the price will go another 25-30% down from current price ($32), and see $24 in the following weeks. We may go a bit higher from now (max up to $35.5, 50% fibs level, but unlikely) before going down to $23-$25. In addition I see a very strong support around $24. Also, pay a close attention to MACD. I see higher Lows! But needs more confirmations.
I remain bearish as long as we stay below 21 weekly MA (pink line).
Summary: My next buy in price range is $25-$28.
Good Luck.


$TLRY - I expect $CGC to followjust like with chart similarities with Lyft and Uber. $TLRY tends to pave the way for $CGC.


Tilray, Inc. (TLRY) long.All description on the chart.
Please, don't forget to like and follow.
Thank you.

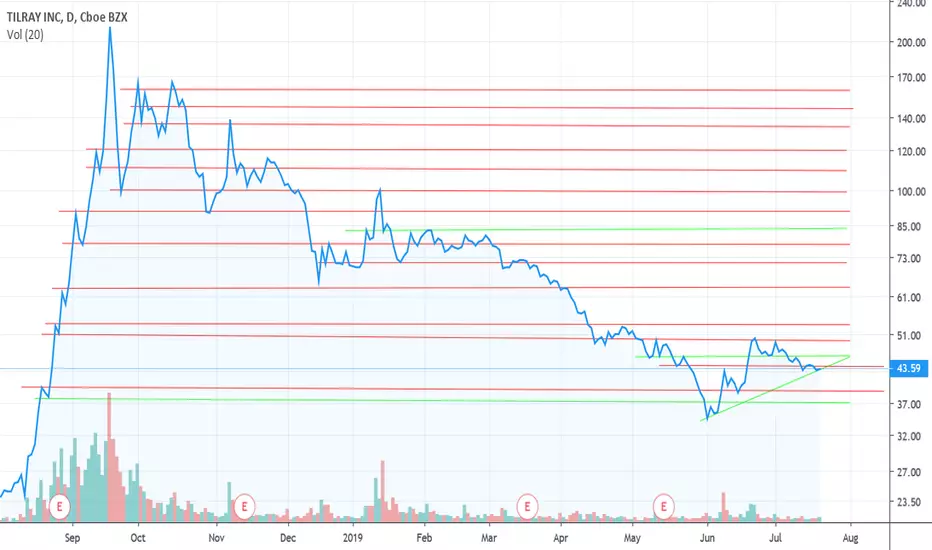
Go long if we break this downward channel and the 50MAMy view is we are at the 50 MA which acts as a resistance.
What I'd like to see, is TILRAY closes above ~$44 to go long, and shoot for $63

Can Tilray Get Back to over $100?Looking at Tilray with the MACD and Megalodon indicators, we can see a buy signal on the daily for Tilray. Something that we've seen only twice before, both times being the start of significant rise. The Daily MACD doesn't have as much room to turn as did previous signals, however it does look a lot sturdier and supportive. As of right now though, we cannot chase this stock. Looking at the shorter time frame we can see a strong sell signal from the Megalodon. So while I am feeling confident about Tilray in the long term, we must wait for a short term correction to find our buying opportunity.
The Megalodon indicator uses a machine learning algorithm, combined with data from over 500 buy setups, and over 2000 indicators to produce extremely accurate buy signals on any and all asset classes! You will also receive real time buy and sell signals for the stock market, cryptocurrency, as well as forex markets! We also busy completed our cryptocurrency automated trade bot. It trades for you, using our backtested indicator with phenomenal results! So try it today!!!

TLRY dont FOMOIf you missed the start of the breakout, dont rush buying now, as it might pullback around 42.09 before completing its C wave around 52 to 56

$OGI Showing Signs of a Bottom Despite Continued Sector Rout$OGI has held the 200DMA as support the last two trading sessions & on July 15th. Hammer candle was put in on 7/29 followed by a bullish engulfing signal today.
OGI current trades at a 10x P/E 2019 revenue and a 3-4x P/E on FY2020 revenue estimates. We see several near-term catalysts for $OGI and feel the stock will benefit immensely once the current industry chaos settles down (CTST, APHA, HEXO, etc)
The company announced July 15th, it developed a Rapid-Onset Nano-Emulsification Technology for Cannabis Beverages with an initial onset of 10-15 mins vs 60-90 mins on average. The company also clearly told the market they're actively seeking a beverage partner & is for sale.
Management has proven they can execute with positive adjusted EBITDA 4x Qs in a row, minimal dilution to shareholders vs peers, disciplined w/ expenses (No $600M losses here), and a very transparent with investors. $OGI management won't pump the stock & give unrealistic guidance like some of its peers, $OGI is focused on building an operationally sound profitable cannabis company in Canada & Internationally.
We expect $OGI to get a lot of attention from institutional & retail investors state-side in 2H 2019 as investors begin to pay more attention to market caps, margins, profit/loss, etc. The industry is maturing very quickly and we believe investors will begin to see $OGI as a Top 3 LP.
Time will tell...
***Disclaimer: I am long $OGI. I wrote this article myself, and it expresses my own opinions. I am not receiving compensation for it. I have no business relationship with any company whose stock is mentioned in this article.***

TLRY WeeklyLooks pretty nice on the weekly. There might be more gains in the works in the next 5-8 weeks.


Last chance to buy TLRY sub $50!Update on TLRY. Please like/comment if you see value in this post. Thanks.
My previous post/analysis/thought is still in tact ( )
I found that the current price action found the blue channel very well. Also, the bottom blue line in that channel is very compatible with the other part of the price chart.
I still think any purchase within that green box would be a winner buy and this could be the last chance to buy TLRY below $50.
The Fib Circles in green still plays very well. I expect to see another drop as we approach/pass the next green circle and in general I expect to see the price chart follow the channel in blue.
ADX and DI looks very healthy and supportive too, the green line is above the red and DI looks like growing (getting more momentum).
TLRY finds a good support on 50-day MA as well.
Good luck.

TLRY is in accumulation phase, time to BUY!Here is my update on TLRY . Please like/share if you find value in this note:
Overall thought: We are in accumulation stage. Bull run has not started yet and it is a good time to buy gradually.
I see these:
1) The 21-day MA is breaking the 50-day MA which is a positive sign (bullish). 21-day MA has been below the 50-day MA for almost 245 days! (35 weeks).
2) The TLRY price was able to stay above 50-day MA for 15 days (2 weeks). The last time we were above 50-day MA for 15 days was before 23 October 2018!
3) The price trend is shaping a bullish pattern after the local low of $34.34 around 04Jun19. The sharp slope in price change is getting milder and milder. I showed them with small purple line on the chart.
4) We are going to have a crossover on the MACD indicator on the daily chart (price action might reverse on the daily scale, i.e. temporary downward movement ). To support this, I see a very thin candle with bigger wick on top on the weekly chart (This is another sign of downward movement)
5) The pitchfork lines drawn long time ago is still intact nicely . The current price action is following the bottom channel. That means I do not expect the price go below the thickest red lone. I expect TLRY to move within this channel for a while till it gains enough momentum for an upward move to the the upper channel.
Summary:
Based on all the 5 facts, I think the price will go slightly down (probably down to the light blue line). Note that there is a possibility to retest the previous bottom (~$35). Also, note that there is a strong resistance level at $44.5. So, we might go down to that level within next days or week then we go back up to retest the upper pitchfork line (shown with the orang arrow). When we go above that line, I will be VEEEERY bullish ! As long as we stay within the lowest pitchfork channel, I think everything is supper healthy and any purchase within that range would be a winner/safe/reasonable buy.
Good luck,


Spot a Good Momentum for TILRAY $TLRYEverything is on the board, I just throwing ideas for comments
But the spot seems really nice !
8 months bear market over and RSI over 50 to mark the shift to BULL MARKET !
Keep an eye on !
GO $TLRY
