TLRY Spike StudyJust studying some and figured to put some thoughts to writing, solely for my own friction of thought.
$TLRY's sudden price jump occurred during the formation of a minuette 5 wave, which extended. The steep sell off right after, was pretty scary, but expected at the same time. I am trying to decide if we witnessed an anomaly, or if this insane price action marks the beginning of a reversal. The fact that it was a wave 5 certainly justifies the sell off, but there are several waves of higher degree, that haven't been completed yet.
There are many catalysts for the industry ahead, this year.
There are many catalysts ahead for TLRY, once the merger completes
The spike was caused by a short squeeze, meaning investors were correct to be bag holders, and shorts had to cover their positions
The sell off brought the price back to pre-squeeze levels, and found demand, confirming the above.
So now what?
There are examples of assets that spiked, then traded sideways for a time, before continuing higher. $GRWG is a good example, when it spiked from $2 to $20. If you study that spike, you see a retrace of 50%(ish), 2 months sideways chop and then started on a textbook impulse wave to the current level of $55, with both spike, correction and impulse wave following Elliot Wave Theory to a tee.
Frost and Prechter, page 66, describes behaviour following fifth wave extensions:
"The most important empirically derived rule that can be distilled from our observations of market behaviour is that when the fifth wave of an advance is an extension, the ensuing correction will be sharp and find support at the level of wave 2 of the extension.
As marked on the chart here, you see the extension take off from iii, then plunge back into the ii range that I marked with green. The book continues:
"Sometimes the correction ends there, and sometimes only wave A ends there. Although a limited number of real life examples exist, the precision with which A waves have reversed at this level, is remarkable."
and finally:
"This guideline need not apply when the market is ending a fifth wave at more than one degree, yet the action suggests that we should still view this level as at least potential or temporary support."
For $TLRY, I am quite confident that we ended minuette 5 of minute 3. Even if I got a degree wrong here, we are still looking at minor 3 inside intermediate 3. So, in theory, we still have a series of 4-5's to complete before this primary wave is complete. At the same time, the top of minute 1 is at $9.66, so this asset has lots of room to move.
Trade with caution.
TLRY

short term +500% (also look at ganja penny stocks +1,000%)Tilray, Inc. engages in the research, cultivation, production, marketing, and distribution of medical cannabis products.

TLRY is going down. 30% profit opportunityNASDAQ:TLRY just broke under a massive support level. Most signs are showing that it will go down to the take profit area shown on the chart.
⚠️ Let me know your feedback and comments below!
⚠️ Follow me if you would like to see more analysis like this

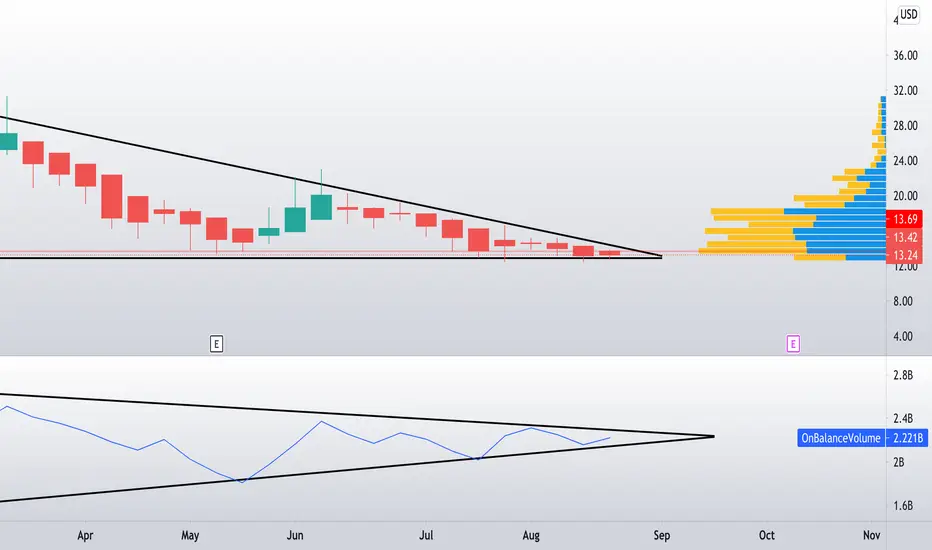
Tilray $TLRY Set Up For Breakout The chart here really speaks for itself. $TLRY is coming to the end of the Falling Wedge it has been trading in since February and is very likely going to break out to the upside.
We are also seeing higher highs on the RSI while the price is dropping. This is bullish divergence, paired right at support, making this a very clean setup.
A very modest target will be $17 after successful breakout and in my opinion, has room to go higher.

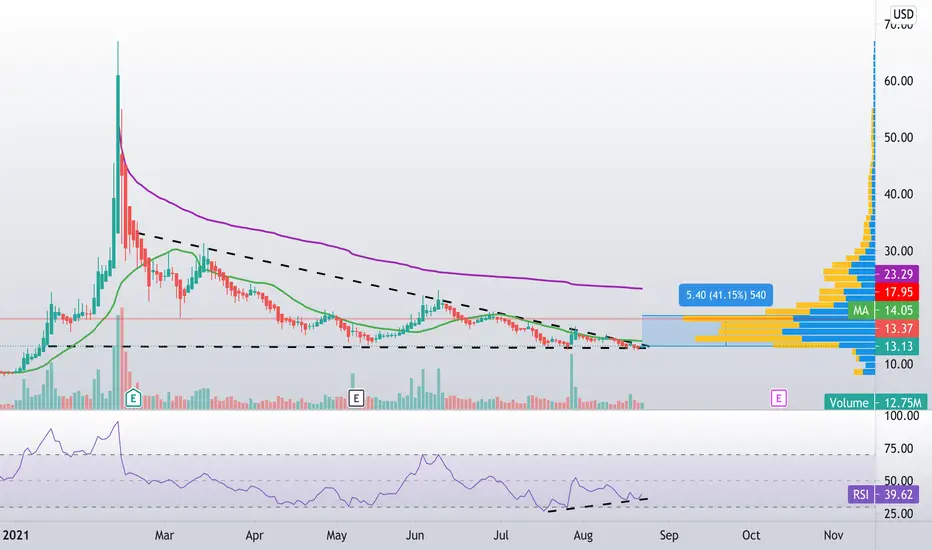
TLRY - Massive falling wedge brewing Expecting 2 more months of punishment in the MJ sector. Still looking for $10 gap to be filled.. Either way, $36 EOY TP.. GLTALs


TLRY Inverse Head and Shoulders PatternNASDAQ:TLRY is attempting to break out of an inverse head and shoulders pattern. The pattern calls for a measured move target around $13.


TLRY: Time to get high?Just bought Tilray🌿 stocks @ 12.22, currently at trendlines & previous significant high confluence. Price needs to break up the red falling wedge. Target 122 which means 10x.
The blue uptrendline on log scale (imo false break down) and also higher volume this year shown below:
Please like👍, comment🗣️, follow me✒️, enjoy📺!
Disclaimer: I'm not financial advisor. This is not a financial advice. Do your own due dilingence.
NASDAQ:TLRY
TSX:TLRY
CAPITALCOM:TLRY
FTX:TLRYUSD
SIX:2HQ
NEO:TLRY
SWB:2HQ
XETR:2HQ
FWB:2HQ
MUN:2HQ
HAM:2HQ
HAN:2HQ
BER:2HQ
FTX:TLRY0924
NASDAQ:NDAQ
OANDA:NAS100USD
CURRENCYCOM:US100

TLRY Daily TimeframeSNIPER STRATEGY
This magical strategy works like a clock on almost any charts
Although I have to say it can’t predict pullbacks, so I do not suggest this strategy for leverage trading.
It will not give you the whole wave like any other strategy out there but it will give you huge part of the wave.
The best timeframe for this strategy is Daily, Weekly and Monthly however it can work any timeframe above three minutes.
Start believing in this strategy because it will reward believers with huge profit.
There is a lot more about this strategy.
It can predict and also it can give you almost exact buy or sell time on the spot.
I am developing it even more so stay tuned and start to follow me for more signals and forecasts.

#MJ: Pot stocks bottomed?There's a big weekly down trend that had ran its course in pot stocks, and the daily chart is reversing here, odds are we can squeeze 10-11 times the risk if we go long here with a stop around 16.18, it is worth a shot with something between 0.25% and 2% risk in the trade. Up to you, how much you risk on it. I'm being conservative and sticking to a 0.25% max risk if the trade fails.
Cheers,
Ivan Labrie.

CGC - Your chance to feel good about your weed addictionThis is truly, your one and only chance to prove to your wife that your weed addiction is paying off. After awhile, she will join you, don't worry. You are just an early crusader, the pilgrim, the visionary and she doesn't know who she really married - THE LEGEND. This is your chance fellas don't blow it.
I mean look at this beauty.
I am holding this bag until it reached at least $100 and then $120. Options - F that. Buy and hold.
If you want to get into a growing market - this is it. Do you know how many people out there have never tried it? Do you know what happens after they try it? A huge line around the corner waiting to get in the MedMen store - the Apple of cannabis. Watch Tilray, CGC, Medmen, etc, closely.

TLRY - I AM INTERESTED NOWJumping on the weed wagon here. Using monthly logscale, I like the setup of the chart here and if triangle can hold, looking for something in the 30's.
#TLRY

CGC - Go long, REAL LONGCannabis trades like crypto.. Retraced 80%, now ready for a other runup.. only a matter of time before federal legalization occurs then massive upside

TILRAY - TLRY - BullishI was contacted by a concerned investor, here's some reassurance.
I've been interested in the booming Cannabis industry within the US & Canada - It's only a matter of time before more countries start to realise the medicinal properties of this.
Previous Close 12.83
Open 12.93
Bid 13.08 x 1300
Ask 13.09 x 1400
Day's Range 12.80 - 13.17
52 Week Range 4.41 - 67.00
Volume 7,612,316
Avg. Volume 24,820,344
Market Cap 5.903B
EPS (TTM) -1.36
Earnings Date Nov 08, 2021 - Nov 12, 2021
1y Target Est 17.60+
Holders
4.68% of Shares Held by All Insider
12.48% of Shares Held by Institutions
13.09% of Float Held by Institutions
401 Number of Institutions Holding Shares
NASDAQ:TLRY
TSX:TLRY
CAPITALCOM:TLRY
FTX:TLRYUSD
SIX:2HQ
NEO:TLRY
SWB:2HQ
XETR:2HQ
FWB:2HQ
MUN:2HQ
HAM:2HQ
HAN:2HQ
BER:2HQ
FTX:TLRY0924
NASDAQ:NDAQ
OANDA:NAS100USD
CURRENCYCOM:US100

TLRY. old ceiling new floor first, then higher.price will almost definitely attempt to go lower. If it fails to do so, there could be a big buyer surge.

This is insanely bullish...I wish I had more money to invest.....This is the point many lines are gonna reach to each other.

$TLRY Bull Wedge and Some Targets$TLRY has a well-formed bullish wedge. There are two targets based on this structure.

Keep MJ stonks on watch. Aurora Cannabis breaking outACB breaking out on bullish divergence. can expect 8.5 this week if momentum picks up

TLRY wants to get highWent long 100 shares $14.3 first target $18.5 with continuation to AVWAP at $23.3
Just an idea a breakout below the wedge invalidates idea..
Breakout above it's time to get high : P
Weeds on fire..!I would like to review my post on August 15:
Tough week ahead for Cannabis Stocks!
You judge the accuracy rate!

ADDED to $TLRY NEW Target 27.00 for 86.46%$TLRY Target 27.00 for 86.46%
Ok so I added here today to my underlying position.
I also played some options that expire tomorrow and I closed the call side out with a 50% gain even, and the put side with 38%… so I think I’m figuring this whole options thing out. Added to my position with my wins… 💃🏻
-----
—
On the far right of the chart is my Average (Grey) Current Target (Green), and Next Level to add (Red) Percentage to target is from my average.
ONLY ADD at support levels & FIB levels… labeled
I start every position with .5 - 1% of my account and build from there as needed and as possible.
I am not your financial advisor. Watch my setups first before you jump in… My trade set ups work very well and they are for my personal reference and if you decide to trade them you do so at your own risk. I will gladly answer questions to the best of my knowledge but ultimately the risk is on you. I will update targets as needed.
GL and happy trading.
