BTC and JNK/TLT ratioI plot BLX (which is BTC) along with JNK/TLT ratio.
JNK/TLT ratio is (Junk Bonds ETF) / (20 year bond ETF ) . This ratio can serve as an indicator, to show if the market is loving risk or loving safety on a macro level. Risk on to risk off ratio. You can see that the JNK/TLT ratio correspond with market bull & bear cycles. Notice the JNK/TLT tops form a trend line, and have some correlation with BTC tops - though not to the exact day or week.
I used the green box to mark a kind of fuzzy area, where the JNK/TLT did not top at the same time as BTC.
Notice the end. Will it touch the trend line as BTC tops out? Or Is it possible it plays out like the green box range, where BTC tops, and the JNK/TLT dances along underneath the trend line a bit further, because the stock market hasn't finished its run yet? Or did BTC top at $69k already? Make your own conclusions. I'm in alt coins. :-))))))
Green lines indicate JNK/TLT tops and red lines JNK/TLT bottoms. I then drew them up to BTC looking for correlation.
I learned this chart from "Game of Trades"
TLT

debt is the problem, debt to gdp and debt to $spy too hiWill the market just stall for a decade or 2 as we work through the debt and allow the economy to catch up?
at which debt to gdp and sp500 levels will the debt level be healthy? SPY GLD SPX QQQ TLT IEF DIA VTI AAPL

TLT - JunkCo ETF / Not a BuyAs the protestations grew and delusions spread, the Wood Panel
Cult learned the hard way, it's never Sunny at the Loch.
Take heart Bond Dgens, as soon as the Equity Complex reaches it
Lows in March so will the Tilt O' Whirl.
Until then, enjoy.
You received exactly what you indicated you would not.
________________________________________________________
2.5% will push this Junk ETF to 134s.

Leading Indicators Reversal in ProgressInteresting... in the last couple of weeks, as the Leading Indicators signaled a retracement, it appears that it may be time for a technical bounce...
JNK broke down as expected, and exceeded target. Last week's candle had a long tail recovery, and this current week is forming a rebound.
MACD still in bear territory.
IWM, DJT and VALUG all seemed to have retraced hard, and bounced off a support. MACD crossed and still in bear territory... may not be over. sus.
TIPS failed a support and does not seem to be recovering, not bouncing for the matter. MACD appears to be recovering though. This one is rather odd, so I would just note and leave it for now.
TLT is not bullish as one would expect it to be. In fact, it looks bearish, which is favorable (bullish) for the equity markets.
VIX failed a solid break out and looks to be finding 16 again, signalling the interim volatilty is over and more bullish markets to prevail.
/HG Copper futures are held in a tight range and appear to be recovering this week - if it can hold steady and break out. MACD is not yet bullish.
Overall, the leading indicators are signalling an interim bottom. perhaps a larger than expected rebound should follow in the coming weeks...

TNX - 10Yr Yields Sell Offers and Bond VX / Trouble
Bond Bagholders just never learn - this Secular Cult is doomed to extinction.
The two-year Treasury yield posted its biggest single-day jump since the
market volatility of March 2020.
Of course, this was after Federal Reserve Chair Jerome Powell promoted
the Policy Flip Flop that the Fed will raise rates in March, and left the screen
porch door open for a quicker than-anticipated pace of rate increases.
The Dot Plot is wiggling in excitement.
IN reality, the FED will begin to Temper expectations.
It is what they do - Lie Cheat Steal / Delay.
10 Yr Yields have seen another fantastic ROC-driven Spike which advanced
well ahead of the Pre-Spring Meltup in 2021.
__________________________________________________________________
TNX will provide a very large indication as to how the preset Wedge on the ES/NQ
resolve, likely this week...
Keep it in purview at all times, sudden violent reactions are to be expected.

Gamestop - MOASSIdea for GME:
- The MOASS is here.
- There is a global shortage of both US dollars and high quality collateral for debt (10-year US Treasury bonds). Why would the dollar be rising despite the high CPI prints? It's simple. To borrow, one must have collateral.
- CS's Zoltan Pozsar explained in Nov. 19th Global Money Dispatch that currently, this demand is caused by Europe. "the ECB bough too much , reducing net supply via QE, and it topped it up with TLTROs... This week, the collateral shortage in Europe spilled over into the FX swap market: on Tuesday it became cheaper for a euro deposit holder to pay a premium and swap euros for dollars and buy Treasury bills with those dollars than to buy German bills."
- While I won't go into it, it is speculated that Citadel has a great short exposure to 10-year US Treasury bonds, through their repo market arm, Palafox. May or may not be true, but it is evident that someone (probably every hedge fund) is short USTs and they are also short GME. GME by extension is a bond market volatility proxy. As long as the correlations hold, it can be traded.
- What is also true is that Large and Small speculators are record short 10 Year T Note futures, while commercials are record long. Bond market volatility is reached a level where VIX was trading at 50+ previously and is higher now than what it spiked to during GME's first squeeze to 500. Somebody is about to get to get blown up.
Bond Market Options Volatility (MOVE) leads GME by 15 days. Timing of MOASS, Dec.3:
GME losing correlation with IWM and gaining correlation with VIX and USTs (new regime):
You might get one more smash down (I expect a smash in bonds in a risk parity event before a squeeze), but I am confident this is about to happen. I'm not even going to give a price target, but it's over 4 digits for certain.
When I did analysis for my AMC trade, I correctly read the psychology of the large market participants, after reading into it more and connecting the dots, turns out they were BlackRock and Citadel:
If you are short GME, do you even know who is on the other side of your trade? Retail "apes"? No no no!
BlackRock, who manages the US assets of foreign sovereigns, and ICBC China, with a 100% correlation to GME. China is about to enter an easing phase:
GLHF
- DPT
Causation always produces a correlation. Liquidity takes time to flow through the economic machine.

NASDAQ BIG PICTURE ... ROTATION INTO VALUE IS STILL EARLYA look at the Nasdaq, SP500, and bonds after the fierce selloff that took place to start January 2022.

TLT A RUN TO SAFETY BULLISH We hit the targets this morning in tlt would trade net long from here out

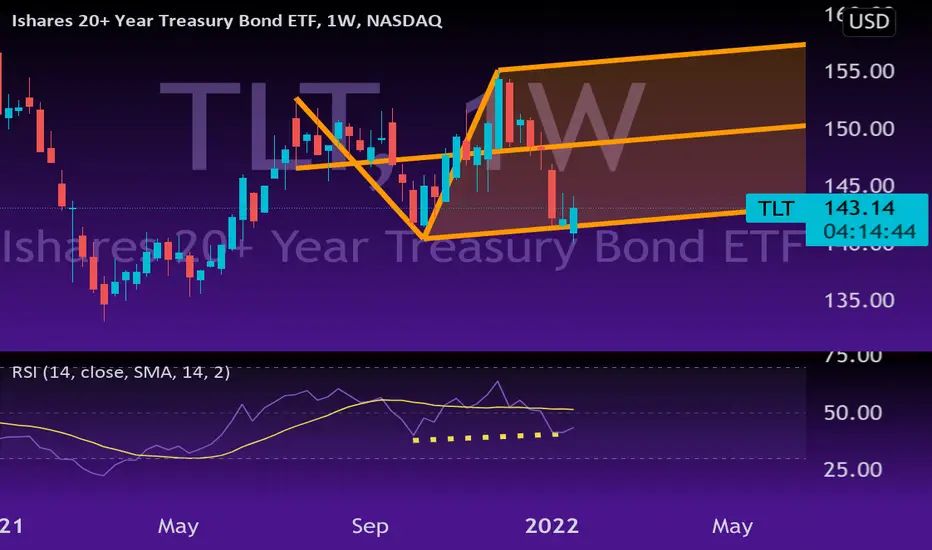
TLT bullish weekly, possible reversal, bull divTLT bullish weekly, possible reversal, bull div
GRI
2022
𝗦𝗺𝗮𝗹𝗹-𝗰𝗮𝗽 𝗨𝗽𝗱𝗮𝘁𝗲: $IWM Daily. WARNINGConcerning chart. Looks like a backtest today ... as long as below 209 there's substantial risk to the downside
$RTY_F $AMC $CROX $SPY $ES_F $QQQ $NQ_F $VIX $TLT $TNX $DXY #Stocks #Trading 📉

𝟭𝟬-𝘆𝗲𝗮𝗿 𝗗𝗮𝗶𝗹𝘆: $TNX Daily. Resistance HoldingPossible the market has gotten ahead of itself on the rate rise? 4 hikes fully priced in already. Ascending channel at key resistance area
$TLT $ZN_F $ZB_F $TYX $DXY $SPY $VIX $QQQ #Tech #Rates #Trading

TLT - Daily 139s PO AchievedThe rest will be up to 10 Yr Yields.
1.96 is the throw-over.
Price Objective #1 has been met.
______________________________
We will see how the 10 Yr responds @ 2%.
Acceleration or Rejection.
________________________________
The largest Selling in US BOND History began
in late Q1 2021.
Apparently, that was lost on the Bond True
Believers.
It returned en Vogue to shock, dismay and
the horror of those who chose convention.

$TLT Monthly has a bearish crossoverAs rates rise, TLT showing more and more weakness by the day and is testing critical support levels. While the month isn't over we have produced an aggressive crossover sell signal. If inflation expectations and rate rises / QT continue to come to fruition I would expect rates to continue to rise. Which is a bubble / stonk headwind.

TLT Call Credit Spread 149/152 call credit spread - Filled for 0.36 - >10% Return on Margin
I believe that the 20 years will continue downwards with rate hikes. As such I have setup this call spread to take advantage of the downward move. This position was opened on Jan 11th but I just got around to posting. See blue vert line for entry date Candle.
Additional premium was collected due to selling on a up day, entry now can be had for a similar credit if not more.

TLT - Extreme Losses Ahead / Bond Market Peak March 2020Yields rising will only serve to further drive - ZN (10 Yr Futures), ZB (10 Yr Futures), and TLT
into the Abyss.
They have all broken down, with the 10 Yr Yield moving up significantly Friday back towards 1.8.
We indicated over the past 7 Month the day of reckoning for Bonds was fast approaching. In November
I doubled down with further warnings explaining in great detail the larger Issues for Bonds to reiterate
the Intermediate and Long Term Risks.
My Thesis for Bonds was they would become "perpetual" Instruments whereby Holders would be
able to clip their Coupons but unable to redeem them one day in the not too distant Future.
The Debt cannot be serviced, even with cheaper Dollars. We see the effects of all the excesses
sloshing around. It will continue to choose valueless propositions outside of Real Estate, Equities,
Metals, Commodities, Energy and Meta in the Wings.
The Wind cried Mary over and overstating it was lunacy, Bonds would benefit in any serious Selling
of Equities. In Sum, I was the fool, idiot, and wrong in the absolute.
This has not happened, instead, the conventional analysis, dependent on a Paradigm that no longer
exists... it failed and very badly.
The Curve is not steepening. This is where the Bond Participants, Touts, and YouTube Tribe - got it 100% wrong.
It is quite simple - there are Capital Stocks for rotation, Equities will eventually see inflows as Bonds continue their
collapse. TLT will be decimated as will ZN and ZB.
As Captial from Bonds flows to Equities once the breakdown finds Bond Buyers exiting the Complex as they
realize their mistake(s) - this will serve to drive Equities far Higher for a short period of time.
This will be the 5/5 of the Larger 5/5 for the Equities Complex.
We will see a parabolic melt-up in Equities once this begins - after this correction completes.
It will be the Fuel for the Final move up in the Equity Complex.
The Federal Reserve will, at some point, go too far, make a large Policy mistake and then Equities will collapse.
________________________________________________________________________________________________
It takes time to turn a Battleship.
Bonds have turned from the Historic End of their Supreme reign for decades.
Price may range for a short period of time, but make no mistake, Bonds have entirely lost
their Status Globally.
If you somehow believe the Federal Reserve will support the Bond Complex, you have had multiple
opportunities to see the Forrest and no longer trip on twigs. It has been detailed here since July of
2021.

Leading Indicators not bullish, slow deterioration observedReviewinig the Leading Inidcator Weekly panel...
The JNK has a Sell signal, retraced and may break down to a lower low target, as previously expected. Not yet happening, but with a lower high, the bias is closer to the downside.
The IWM (Russell 2000 ETF) also has a Sell signal and lower high. Waiting for a lower low confirmation with a break of support.
The DJT is also similar.
The Value Line failed to close the recent gap, suggesting downside bias.
The TIPS clearly broke down through two support levels with a system Sell signal. So this one committed.
All the above have MACD technically bearish bias.
The TLT is oddly breaking down too. No comments about this at this point of time. Just unusual.
The VIX is also unusually complacent, being <20. Technically seeing a possible spike some time in the next two weeks or so.
I just added the Copper futures in the panel... according to Russell Napier, Copper futures is also one of the leading indicators we can use. For now, it is ranging and not committed to any trend.
I hope we get some committed trend soon!
Stay safe!

i HAVE SOLD ALL LONGS IN SP QQQ I HAVE NOW SOLD ALL net long calls as we are rallying IN 3 WAVES UP MOVE OUT TILL WE HAVE 5 WAVES

TLT BOTTOM NEW BULL PHASE 147 NEXTWe have ended the drop in TLT today we will now see a run first to 147 area Then I will post as to what the next move could be . But for now long TLT

Leading Indicators point to more the obviousLeading Indicator panel update:
JNK - the topping pattern continues to play out for JNK, looking for a lower low, after the last lower high.
IWM - The Russell 2000 ETF failed a breakout late last year, and is about to break down of a support given the bearish weekly candle.
DJ Trans - a system Sell signal, and likely downside off the Dark Cloud Cover pattern.
Value Line - Similar outlook to DJ Trans, with bearish candlestick that failed to close the gap.
TIPS - Totally bearish Marubozu that broke two supports, with MACD bearish. This market forerunner is not boding decisively bearish.
TLT - Instead of the expected bullishness in a bearish market, we see TLT being dumped with a gap down marubozu.
VIX - still low, coiling to spike perhaps?
ES1! - The S&P500 futures had a Bearish Engulfing last week... indicative of a follow through downside in the weeks to come.
So... the leading indicators overall are bearish, and getting more so, with the S&P500 just became indicative of some real retracement potential in motion.

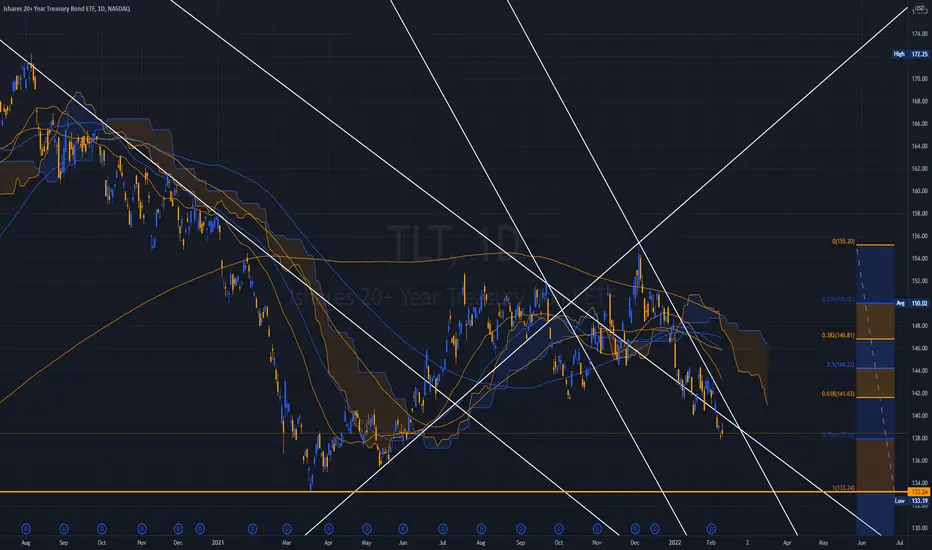
TLT - 20Yr Bond ETFThe Monthly Chart continues to expand in Range.
This is interesting as the Range Broadens the implications
are quite Dire longer term.
TLT was sold heavily prior to the ROC SPike in TNX.
ZN was sold on Volume as well, an Instrument we have repeatedly
discussed for its weakening structure.
__________________________________________________________
Attempting to apply "Convention and Rationale" to an aging Trend
is generally, an Idea whose validity should begin to come into question.
FASB 56 alone is enough to bring the operations within the Shadows of
the Bond Market under duress over time.
It is clear the BIS is backstopping this operation - at what cost, we can
only surmise.
___________________________________________________________
The Real Issue moving forward for the Bond Complex is one of simplicity.
Rates will, in the Short Ter react to Policy and the perceived threat of
Inflation.
Shadow Operations will require time to unfold, but we believe this process
has begun, it will not be brought into he light of Day any time soon, but will
eventually, appear in the form of unexplained loss of confidence around the
Globe.
This will, of course, be devastating to the US Dollar. rendering it a 50 Level
once 82 and then 77 are broken.
_____________________________________________________________
The competition between China and the United States is well underway
and is accelerating on many fronts.
With the US Losing its advantages due to its inability to produce Value
across former dominant Sectors of Global Trade - a 22nd Century pivot to
Asia will continue to gain in both scope and scale, as well as velocity.
Financial Isolationism within the approaching rebalancing of Global
financial Arrangements will render the US to a weighted SDR status
with less than favorable terms and conditions.
This will have a devastating effect on the US Bond Market.
The curve will be converted to a Perpetual Duration with Principals
retired. A balance sheet liability which cannot be reduced without
far greater and far more insidious distortions.
It can never be eliminated.
Never, it is not mathematically possible. Therefore it will be erased to
bring balance. Think of it as the FDIC/SPIC coming to save $250K of your
$20 Million.
You lose, they win.
They default in an extraordinary manner and provide token assurance
that... one day... they swear to make you whole.
It will never happen.
___________________________________________________________
This is axiomatic, pure, and simple.
Regardless of the Gyrations... The Future is not "Uncertain" with respect
to Bonds and how they will be all but eliminated.

TNX - Monthly Historical Chart 40 Year ChannelThe Event which will provide relief to the Bond Complex is the Federal Reserve
walking back its most recent Policy Statement.
The Short End of the Curve witnessed an aggressive move of 6-9 Bips. This doesn't
appear to be much on the surface of it.
Unfortunately, it is.
______________________________________________________________________
The Yield Curve is not effectively communicating at either end and throughout the
Curve.
Far too much is made of prior Paradigms, with a real lack of understanding of the Glacial
movements in the Bond Complex.
40 years is a long time - an unparalleled Bull Market in Binds coming off the Volcker Era
after the Whip Inflation Now Era.
Price in trend - it remains in Trebbt as the sheer largess of the Bond Market is 11X that
of Equities.
_______________________________________________________________________
The Risks remain to Rates rising.
Hopefully - there is not a disorderly eruption as it would wreak havoc in ways we have
not seen in a very long time.

