Rolling (IRA): TLT December 15th 91 to Jan 19th 90 Short Put... for a .26 credit.
Comments: I could let this ride, but would rather be assigned at a lower strike (if it comes to that). Collected .86 for the 91 (See Post Below). Another .26 here results in 1.08 collected.
TLT

TLT Core Position (IRA)In the absence of some kind of face-ripping rally, I'm going to be assigned shares in TLT here shortly, starting with what began as an October 20th 93 short put and an October 20th 89 short put. Here, I'm using short puts as an acquisitional tool, attempting to acquire shares in multi-year weakness, after which I'll proceed to cover the shares with short calls. The short call premium, along with TLT's monthly dividend, will result in positive cash flow.
There are a couple of different approaches I could utilize here to manage the shares I'm assigned, one of which is to sell a call against each individual lot I'm assigned, laddering out short calls in time as I'm assigned shares. Since I've got quite a few contracts subject to assignment, this would result in sort of a covered call spaghetti-works.
Another simpler approach would be to see what the average cost basis of all the lots I'm assigned is, and then proceed to sell calls at or above that average cost basis in a single expiry. For example, the average cost basis of the two rungs shown here is (89 + 93)/2 or 91/share. With that cost basis in mind, I would proceed to sell two calls at or above the 91 strike at a reasonably delta'd strike in an expiry that's paying. Given the distance price has pulled away from my likely average cost basis, the calls are likely to be somewhat long dated.
Given the fact that my highest short put strike is at 94, I'm more likely to sell calls at 94 initially, wait to be assigned everything that I'm going to get assigned, look at the average cost basis at that point and then adjust the short calls accordingly. Because of its simplicity, this is the approach I'll be going with, looking to stay in the shares and manage the entire position on a fairly long-term basis.
As usual, we'll see how it goes ... .

$TLT bottom. Upside ahead targeting $100+As I wrote in my last post on TLT, I had a target of $88. $88 was hit on Friday and is now slightly below it today.
I went long both via spot and calls. I took March 15 2024 calls at a $101 strike price and I'm anticipating a large move higher playing out by then.
I've marked off resistance levels on the chart. Let's see how it plays out over the coming months.
I'm not a believer in the rates are going to stay higher for longer narrative. I do think they'll be higher than where we were in 2021, but I do not think they'll stay at 5+%. I think the financial system will end up being in trouble and the only out will be to bring down rates again. I do think that'll play out sometime in the next 6 months.

BondsUS10Y breaking support. Good entry on bond etf's. Only picking up a small amount to get in the door. ZROZ, EDV, and TLT.

Opening (IRA): TLT December 29th 90 Short Put... for a 1.20 credit.
Comments: Adding a rung out in the Dec 29th expiry at a strike better than what I currently have on.
Since I'm in an acquisitional frame of mind with TLT, I'm pretty much going to run with these until they're approaching worthless (i.e., <.05). If I get assigned, I'll proceed to sell call against.

Rolling (IRA): TLT November 3rd 88 Short Put to January 19th 87... for a .42 credit.
Comments: Received an .88 credit for the 88 (See Post Below); rolling it down and out for a .42 credit. Total credits collected of 1.30.
If I'm going to get assigned, lower is naturally better, even if it's only a strike ... .

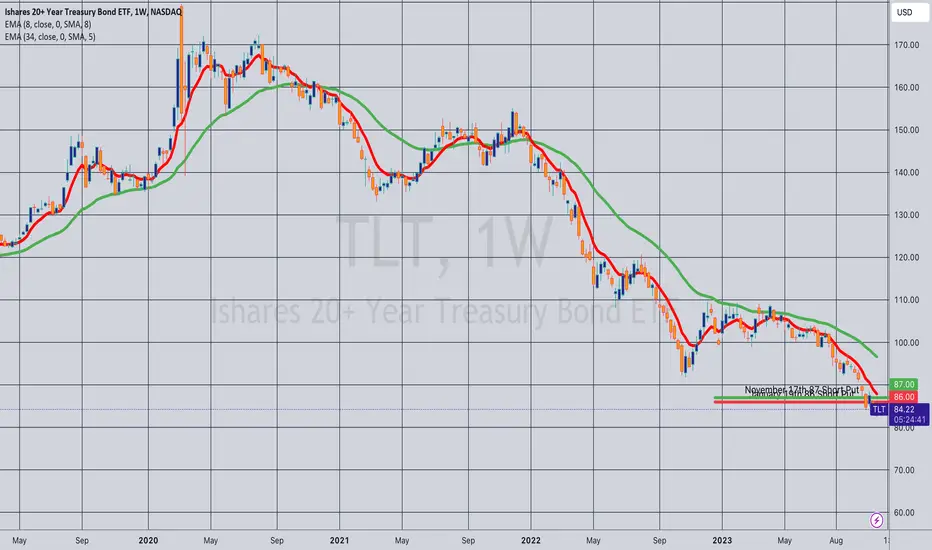
Rolling (IRA): TLT Nov 17th 87 to Jan 19th 86 Short Put... for a .65 credit.
Comments: Down a smidge and out. .76 collected originally. (See Post Below). With the .65 collected for the roll, 1.41 total.
Opening (IRA): TLT January 19th 81 Short Put... for a .85 credit.
Comments: Targeting the strike paying around 1% of the strike price in credit, looking to acquire shares should we get "down there."
I would've erected a rung in shorter duration, but didn't want to do that if I couldn't get in at a strike that was better than what I currently have on.

Opening (IRA): TLT December 15th 89 Short Put... for a 1.12 credit.
Comments: Squeezing in another rung in the December monthly at the 28 delta 89 strike ... .
Since I'm getting kind of a spaghetti works here, will primarily look to add in the 45 DTE weeklies and manage the rest of the pasta as duration in those positions shortens.

Opening (IRA): TLT Oct/Nov/Dec Short Put LadderComments: Targeting the 16 delta strike here in successive expiries to generate free cash flow and emulate dollar cost averaging into 20 year+ maturity paper.
October 20th 89: .77 credit.
November 17th 87: .76 credit.
December 15th 86: .84 credit.
Since these aren't paying buckets of cash on a per contract basis, I'll look to manage these on extrinsic approaching worthless either by closing them out in profit or rolling for credit and duration to reduce my cost basis further.

Opening (IRA): TLT Nov/Dec 86/84 Short PutsComments: Targeting the 16 delta strikes in November and December to erect rungs at strikes better than what I currently have on to emulate dollar cost averaging into 20 year+ maturity paper.
November 17th 86: .83 credit
December 15th 84: .79 credit
Here, I'm fine with getting assigned and proceeding to sell short call against, but want to get in at the biggest discount the market will let me get away with because at some point, you know they're going to cut. Naturally, this may be months out in time ... .

$US10Y At a Important Pivot Point---
### Market Analysis: TVC:US10Y Nears Crucial Pivot Point
#### Critical Juncture for the U.S. 10-Year Treasury Yield
The U.S. 10-Year Treasury Yield ( TVC:US10Y ) is currently at a pivotal position that could significantly influence market sentiment. This important pivot point is marked by a specific blue line on the chart, serving as a key indicator for market direction.
#### Bullish and Bearish Implications
- **Below the Blue Line - Bullish for Markets**: If the TVC:US10Y falls below this blue line, it is generally interpreted as a bullish signal for the markets. A lower yield on the 10-year Treasury often suggests an increased appetite for riskier assets like stocks, as investors seek higher returns than those offered by government bonds.
- **Above the Blue Line - Bearish for Markets**: Conversely, if the yield rises above this blue line, it can be seen as bearish for the markets. Higher yields may indicate a shift towards a more risk-averse sentiment, potentially driving investors away from stocks and into the perceived safety of government bonds.
#### Monitoring Market Movements
The position of the TVC:US10Y relative to this blue line is a critical factor for investors to monitor. It not only reflects broader market trends but also helps in predicting future market movements. The yield’s behavior around this pivot point could provide valuable insights into the market's overall risk tolerance and investment direction in the near term.

TLT: Bearish Bat with Bearish DivergenceThere is a Bearish Bat with Bearish Divergence on the TLT, which could perhaps be signaling that the 20-year Bond Auction is going to demand higher yield than the current level.

Rolling (IRA): TLT Nov 17th 86 Short Put to Dec 15th 85... for a .32 credit.
Comments: Rolling down and out where it makes sense; out "as is" where it doesn't. Collected .83 originally (See Post Below). With the .32 here, 1.15 total.
I'm generally looking to try to avoid taking on shares above my current cost basis for the shares I've been assigned already and/or to take on shares at the best possible price that the market allows.

Opening (IRA): TLT February 16th 73 Short Put... for a .96 credit.
Comments: How ... low ... can you go? Targeting the 16 delta strike out in February at a strike better than what I currently have on in shorter duration expiries.

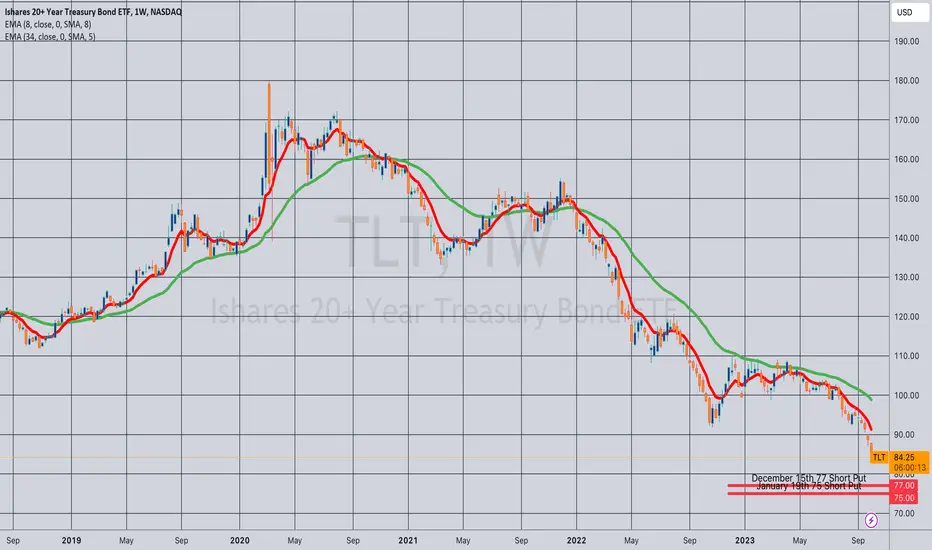
Opening (IRA): TLT Dec/Jan 77/75 Short PutsComments: Targeting the strikes paying around 1% of the strike price in credit at strikes better than what I currently have on. The basic bet here: that interest rates decline ... at some point.
(And, yes, it's been a somewhat painful trade so far ... ).
December 15th 77: .85 credit
January 19th 75: .84 credit
$TLT 20 Year Treasury Bond ETF The NASDAQ:TLT , or the 20 Year Treasury Bond ETF, appears to be undergoing a significant shift in its trend dynamics based on your description. Here's a breakdown of what you're observing:
1. **Bearish to Bullish Reversal**: This indicates that the ETF, which was previously in a downtrend (bearish phase), is showing signs of reversing to an uptrend (bullish phase). Such reversals are often identified through technical indicators like moving averages, momentum oscillators, or trendline breaks.
2. **Parallel Downtrend Break**: The breaking of a parallel downtrend suggests that the ETF has moved beyond a previously established downward channel. This is a technical pattern where the price moves within two parallel lines downwards. Breaking out of this channel can be a significant bullish signal, indicating that the selling pressure is easing and buyers are starting to take control.
3. **Bullish Consolidation**: After the initial reversal, it seems the ETF is now in a phase of bullish consolidation. This typically involves the price moving sideways or slightly pulling back, which allows the ETF to stabilize after the initial surge in buying activity. This phase often precedes further upward movement as it suggests that buyers are still interested at these higher price levels, and the selling pressure is not strong enough to push the price back down.
For a more detailed analysis, it would be beneficial to look at specific technical indicators such as Relative Strength Index (RSI), Moving Average Convergence Divergence (MACD), volume data, as well as key support and resistance levels. Additionally, fundamental factors impacting Treasury bonds, like interest rate changes, inflation expectations, and overall economic outlook, should also be considered to complement the technical analysis.
Remember, while technical analysis can provide valuable insights, it's always important to consider multiple factors and viewpoints when making investment decisions.

TLT ~ Have US Yields finally topped? (Weekly / Nov 2023)NASDAQ:TLT chart mapping/analysis.
Note: TradingView chart dividend adjusted.
Price action bouncing off Golden Pocket (66% Fib) support
Heavy trading volume = institutional activity (ie positioning?)
Rejection wicks on previous weekly candles = selling pressure still present (correlation with long-end yields holding strength)
Looking for re-test of lows + bounce to confirm double bottom support base established for bullish momentum.
Inverse play = price action engulfs previous candle, completes gap partial-fill + taps overhead resistance aka descending trend-line (light blue dotted).
Institutional short-squeezes could still be active - complimenting inverse play thesis.
Failure to break above/below either trend-lines = price action continues to contract until eventually ripping in volatile fashion in either direction.
Set alerts - monitor US yields - wait for trade to set up in your favour.

US10 years Bond Yield probably "peak". 10/Nov/23US Bonds probably the "Most Highly Bought Bonds" by any Countries's govermnt in the world (as safe haven). Time to buy US Bond ETF? E.g TLT, AGG, IEF etc?. What do you think saving money in US FIXED deposit bank aiming for 5% +/- gain ( while waiting for US dolar depreciate against most currencies pair) or buying US Bonds ( which is the inverse of US Bonds Yield ) or GOLD!? ( I Prefer Gold).

TLT: 20-YEAR AMERICAN TREASURY BONDS: SHARK detected. 20-YEAR AMERICAN TREASURY BONDS: SHARK detected.
We are in a potential turnaround zone.
The EMA.200 and EMA.50 are possible targets, as well as the red PRZ above.
To watch, as well as the ICHIMOKU / Bollinger / Fibonacci Levels

US10Y - Is it a "sea change" or a strong buy for TLT and TMF ?In December 2022, Howard Marks told in an interview that a "sea change" is underway in markets.
When I have seen below charts of TVC:US10Y , I have remembered that interview:
(Unfortunately I needed to remove the graph due to lacking reputation points. Maybe you can view with //x/HZKlWa8U )
TVC:US10Y was in a downtrend in a channel since 1980 and this long lasting channel has been broken at April 2022, and upper line of the channel became support at July and August of 2022. So there are some signs that it's not a fake going out of channel like the one in 2020 March.
Does Howard Marks right by saying it's a "sea change" ?
And in this weekly chart of TVC:US10Y , we can see it has formed a new uptrend in a new channel:
(Maybe you can view the chart with /x/DHeM0t8W )
See how good it has used that upmoving support. Now, we are again hitting that support and if that support line is broken, it would be a "strong buy" for NASDAQ:TLT and AMEX:TMF .
Both graphs have given bullish divergence recently:
(Maybe you can view the charts with /x/2jGkJkCJ and /x/5NGqJ3Ze )
This week we will see if TVC:US10Y will break the channel and confirm the bullish divergence of TLT and TMF. If the support would been broken at TVC:US10Y , then 4.20 and 3.40 and 2.75 are the levels to watch for the bullish trend of NASDAQ:TLT and $AMEX:TMF.
In conclusion, if TVC:US10Y will break the channel this week, I'm long in NASDAQ:TLT and $AMEX:TMF.
If not, we will keep watching if Howard Marks was right and it's really a sea change.

TLT - Keylevels - WeeklyI am accumulating TLT, I have accumulated in the areas: 83,84,85,86,87 and I will continue to accumulate as long as the price remains below 92.
Over 92, I will stop accumulating.
Macro speaking, we have this falling wedge and once the interest rate cuts on the dollar will start, I expect TLT to react positively.
First of all, we need uS10years to start a correction.

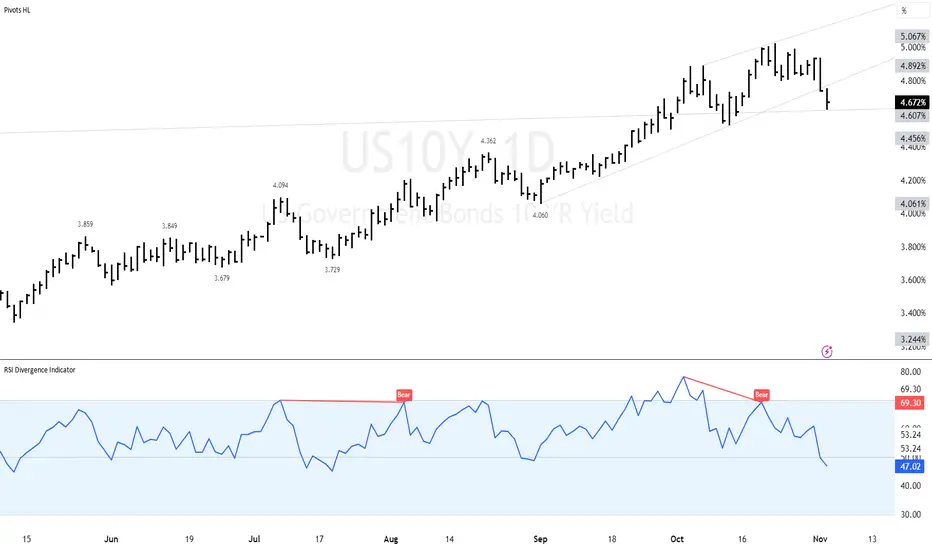
$US10Y Negative Divergence Played Out"The TVC:US10Y Negative Divergence Played Out as we observed a scenario where the momentum indicator, such as the Relative Strength Index (RSI), had been showing bearish divergence with the U.S. 10-year Treasury yield. This indicated a potential weakening of the yield's upward momentum, despite higher prices initially. Subsequently, the divergence 'played out' as the 10-year Treasury yield indeed reversed its upward trend, aligning with the bearish divergence signal. This divergence resolution may have led to a shift in market sentiment or investment strategies, impacting various sectors and asset classes."