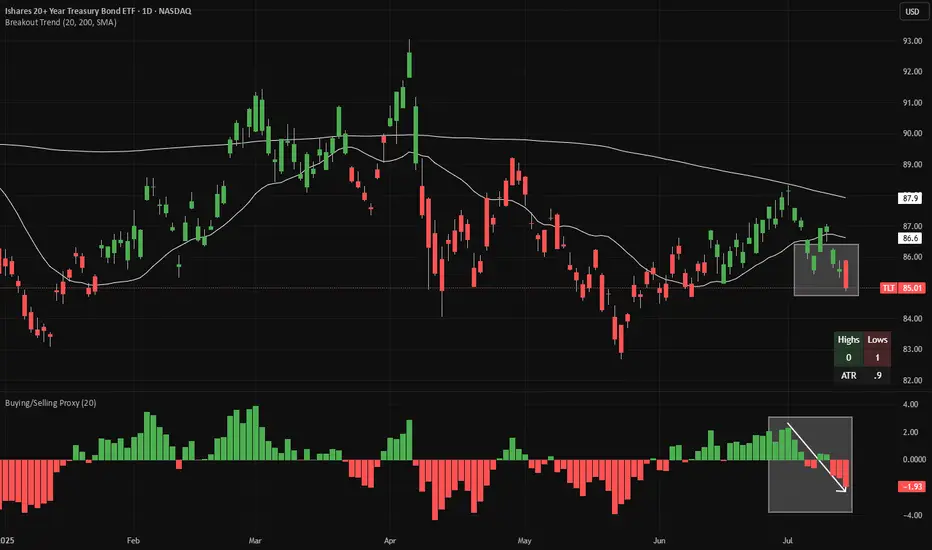
TLT short - warning signs from JapanTLT is making 20-day lows (red candles in the main chart), while continuing to make 20-week lows on a weekly chart (not shown). Meanwhile, looking at a proxy of net buying/selling (bottom panel), we have flipped from buying to selling.
Looking at Japanese bond yields, 10-year JGBs (JP10Y) just broke out of tight range. This is the third attempt to trade above ~1.59% recently, which we saw earlier today. As Japan's is one of the world's leading overseas investors, this is an obvious warning sign for bonds globally.
There is good risk/reward to short bonds here, with a stop-loss if the price closes at a 20-day high. If a 20-day high is made, the candles will change color from red to green.
Both indicators (Breakout Trend and Buying/Selling Proxy) are available for free on TradingView.
Tltshort
TLT wave 1 down or wave DThe chart posted is the TLT I posted this forecast back at 101 where I went Long PUTS I covered All puts at 97.9 . I will Now move to a 50 to 60 % net Long CALLS at 95.00 even Now and look for a wave 2 or a biggger rally in wave E up

20yr yield breakout from C waveCurrently monitoring the 20yr bond yield. On this Chart. I've found a desc. Triangle breakout set up with a bullish wave count. Also notice the yield is at an oversold level for this time frame and below the cloud. I'm looking for the yield to retrace back up above the 5th elliot wave and close above 4.367at minimum before going higher.
Disclosure: I have puts on NASDAQ:TLT

Possible Wave E has ended this is the ALTThe chart posted is Low odds BUT must be looked at as the wave structure and the cycle s turn may 8th is nearing .I Am net long spy msft gld dia I have changed my positions and added this morning near the low in GLD I am also looking to buy BITCOIN I have target 56200 to 55900 but we may not get to it .

Time to flip short $TLT againWe made good money shorting NASDAQ:TLT into the summer down to the initial target I had of $88. Then we flipped long again and I exited my longs earlier this month on Dec 7th. Now, as you can see from the first chart , we've come up against resistance and I think it's time to flip short again to retest the lows.
How low we go is TBD, but I think this move could go to at minimum $95 and at maximum retest, or barely sweep the lows.
I bought some puts yesterday with a strike of $97 for a few months out.
Note: There is a possibility that we get one more retest of the highs before it starts falling (if this happens, I'll add more to my position).

TLT → Strong downtrendNASDAQ:TLT remains in a strong bearish trend.
After breaking through the 93 zone, the bond price rose.
It has not been able to break the first resistance found in the 103.70 zone, and it has another more important resistance in the 110 level.
At the moment I am not going to buy long-term american bonds, and I am still invested in monetary asset investment funds with an average maturity of these assets of less than 90 days.
And what are american fund managers doing?
American fund managers are again massively accumulating short positions against the american bond.

TLT - Keylevels - WeeklyI am accumulating TLT, I have accumulated in the areas: 83,84,85,86,87 and I will continue to accumulate as long as the price remains below 92.
Over 92, I will stop accumulating.
Macro speaking, we have this falling wedge and once the interest rate cuts on the dollar will start, I expect TLT to react positively.
First of all, we need uS10years to start a correction.

TLT At The Warning Line SupportTLT is currently at the Warning-Line of the white Fork.
We can see how price reacts to the Center-Line.
A classical retest that played out textbook like.
Then the same at the BASE Line of the Action/Reaction Set.
If TLT cracks the WL, then the next stop would be the Reaction line.
All this is in line with the destroyed Bond Market.
And that's the reason why I would short TLT on a rebound.
Peace4Theworld

$TLT back below $100, sends it to $88If NASDAQ:TLT manages to break below $100 here, it's next and final target would be $88 before upside.
I think if this happens, risk assets will take a nose dive lower (just like they did last year).


TLT ready to break the resistanceTLT looks bullish
Double bottom pattern on daily time frame.
Enter the long position on the resistance breakout or once the price retests the resistance and confirms it as a support.
Target: 114,36 $

TLT ShortTLT is approaching a technical double top area as the Feb. 1st FOMC meeting looms. Fed futures are currently pricing in a 475-500 bps terminal rate, however some fed speakers over the days have indicated a desire to exceed 500 bps this year. Market thus far hasn't bought that narrative and expects the Fed will be forced to pivot later this year due to recessionary headwinds. This pivot hopium has resulted in a rally in TLT. However, if the Fed raises rates to 50bps in February with 2 more rate hikes to go after that, Fed futures should spike above 5%. This will bring TLT crashing down to the 90-100 level. Even if the Fed only raises 25bps with 2 more rate hikes to go, a hawkish stance consistent with their recent comments about continuing rate increases should eat away at the Fed pivot hopium rally and still result in a drop of TLT to the 100 level. EIther way I don't see TLT continuing past 110 in the near term and this opens up a good short oppotunity.

One more low for $TLT before we see a rally -$88 targetUnless price can break resistance here, we're just seeing another lower high. This sets up $TLT for one more move lower.
I think price is likely to retrace from here and take out the recent lows-- then we should see price bottom in the $88 range.
Let's see how it plays out from here.

TLT ShortTLT broke below support and is targeting $100-$101
Current play holding $106 puts for November

TLT - Head and Shoulders formingJust a pretty straight forward head and shoulders forming. Guess market doesn't like low yields after all? Time frame - probably B-wave rally ahead of next FOMC, then dump before FOMC. I'm trying to trade bear call spreads above 114 using TBT (better use of capital at $26 strike on TBT) and will sell bull put spreads at TLT near 120...probably....on TBT that's a bull put spread somewhere around $22 or $23.
Thoughts?

$TLT looks like it's heading to the $120 rangeTLT looks like it's formed a massive weird looking head and shoulders pattern on the weekly timeframe.
So far, it's managed to hold support in the $134 range. However, that range has been tested a number of times now that I think the next time it test on larger timeframes, support will break. There's little support between here and the $120s so the next logical target to me is at $122-123.
Eventually, I can see it hitting the lower targets at $114.
Let's see what happens over the next few weeks and months.

The Only Trade You Need to Make This Year. #SteeplongendThe long End Of Yield Curve will steepen.
Inflation running hot and CB can't hike rates.
Nobody will buy 20-30Y.
Yields Run, TLT Plummets
Double Top with Divergence.
Both, fundamentals and Technicals there.
This may be the only trade you need to make this year.
Everyone will continue to believe inflation is under control until they don't.
This is a trade we can actually see happening in front of us but, nobody has this priced in yet.

TLT ShortWedge for potential lower
Fractal given for an idea of what to expect
Fractal from 2H20 when reflation trade started

TLT Bouncing Off 0.382 FibFib retracement analysis
TLT bounced off 0.5 and broke 0.382.
Today, it is hitting the 0.382 fib resistance.
Expecting it to come back down to 0.236


