TNA

Russell 2000 - Long playPrice stopped (1) right at Pivot S1 and (2) just above Fib 0.876. RSI is also aligned with previous bottom. If a multi-day uptrend happens from here, the 3x ETF will gain more than 3x by the end of the trend due to positive compounding. If choppy volatility instead continues in both directions, then holding IWM would have been the better bet. Survey: Which would you buy here - TNA or IWM?


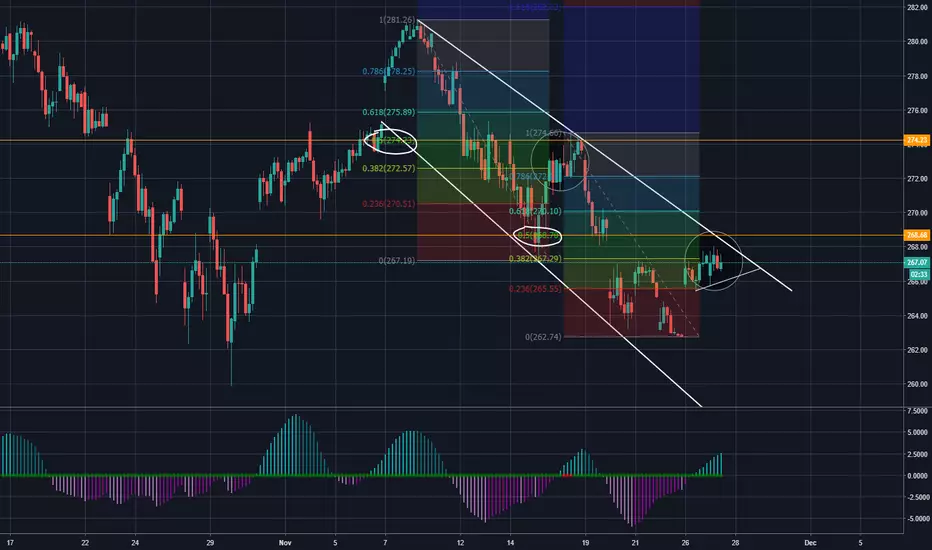
TZA - Short this flawed -3x ETF with stop just above R1This is triple leveraged inverse Russell 2000 ETF. It is flawed due to negative compounding in downtrends.

TNA - Buy and hold to $130-135The third major buying opportunity of this security's life is now. If the coming advance mirrors the previous advance, then $130-135 should be hit (see the two back-to-back Fib drawings). This is a monthly chart and the security is volatile, so expect plenty of choppiness along the way.


Houston- we have a problem.... iwm vs spyIWM has been the spy's faithful partner up chart since 2009. This run is different. I think we may be destined for failure.. until iwm can muster the strength to breaks its trend.
Suppose there's 2 possibilities here. either spy's gonna retreat, or iwm needs to make up some ground.. has a large distance to make a new high. Given circumstances i think retreat makes most sense.
Caution is warranted given conditions and charts history....
GOOD LUCK THIS WEEK!

Monitor with cautionConsolidation has been established with a range of 1548.12 - 1586.77
For the technicians out there who like patterns. A Pivot High was just completed. So, look at the bottom of the consolidation range for your breakout signals.
Anchor bar on the consolidation is a positive bar which suggests a 70% chance of breakout to the top.
Coupled with the pivot high - I would decrease that down to 30%.
This is a mixed bag of directional signals, suggesting the market hasn't decided yet.

$iwm $tsg $tna VIDEO ANALYSIS powerful 2-3 week rally Any Day.Bit money has been moving into these stop options looking for higher prices in the next 10 days!
This stock looks like a solid gamble for higher prices.
Weekly chart breaking will trigger powerful 2-3 week rally.

Utilities, Natural Gas, and Small Caps Present Setups!This video shows a few simple and clear trade setups unfolding in the market for three very different sectors.
Take a look, and if you like be sure to follow me here on TradingView!

$RTY_F $rut $spx VIDEO ANALYSIS - Small Caps Mega Breakout!While the large-cap stock indexes like the $SPY $SPX $QQQ $DIA have been running higher, they are now at resistance and should stall out or at least slowdown. Small-cap stocks have been building a base for a mega rally that could make the large-cap run look like chump change!
See more analysis on the small-cap sector: Click Here

$IWM $RUT $TNA $TZA Small Caps About to Lead The Markets!While the large-cap stock indexes like the $SPY $SPX $QQQ $DIA have been running higher, they are now at resistance and should stall out or at least slowdown. Small-cap stocks have been building a base for a mega rally that could make the large-cap run look like chump change!
See more analysis on the small cap sector: www.thetechnicaltraders.com

$ES_f $spy $spx $spxs Day Trading Index Price Gaps Made EasyThese morning gap trades happen nearly every week providing a steady stream of winning trades.

Two Price targets on the way to being reached - mega double topUsing simple price patterns and fib extensions we get two targets wit juicy gains.
This is much like my NIO 21.7% trade
and also like ROKU 18% trade

Small caps lead rallies and sell-offs, this is no different.Skilled traders watch all the charts to assist them in identifying characteristics that can assist them in understanding price moves, key support/resistance levels, and price patterns. This IWM chart should be on everyone’s radar at the moment. Where the IWM finds support, so will the other US stock market indexes.
The IWM setup indicates we may only see a 5~7% downside price swing before support is found. We’ll have to watch how this plays out over the next few weeks/months to determine if the $144.25 level is true support or if the lower $137.00 level will become support. Either way, the downside price swing appears poised to unfold over the next few days/weeks – so be prepared.
I authored a research article about this pattern setup on February 17, 2019. You can read it here.

Just admit that gold is at resistance and bearish!Just admit that gold is at resistance and bearish!
The chart speaks for its self.
The Russell 2000 ETF continues to deliver critical technical and longer-term price patterns for skilled technicians. Combining the IWM chart with the Transportation Index, Oil, Gold, and others provide a very clear picture of what to expect in the immediate future.
Recently, we posted a research article about the Head-n-Shoulders pattern setting up in the $INDU. Again, the IWM chart is also showing a very clear Head-n-Shoulders pattern with critical resistance near $159.50 and support near $144.25. Our researchers, at Technical Traders Ltd., believe this right Shoulder will prompt a downside market move towards support near $144.25 before a downward sloping wedge pattern sets up. This first downward price leg will setup and congesting wedge formation that will, eventually, break to the upside and drive market prices higher.
I also posted a Russell 2K ( IWM ) forecast here www.thetechnicaltraders.com

Small Cap Bear TrapThe Russell 2000 ETF continues to deliver critical technical and longer-term price patterns for skilled technicians. Combining the IWM chart with the Transportation Index, Oil, Gold, and others provide a very clear picture of what to expect in the immediate future.
Recently, we posted a research article about the Head-n-Shoulders pattern setting up in the $INDU. Again, the IWM chart is also showing a very clear Head-n-Shoulders pattern with critical resistance near $159.50 and support near $144.25. Our researchers, at Technical Traders Ltd., believe this right Shoulder will prompt a downside market move towards support near $144.25 before a downward sloping wedge pattern sets up. This first downward price leg will setup and congesting wedge formation that will, eventually, break to the upside and drive market prices higher.
We authored a research article about this pattern setup on February 17, 2019. You can read it here.
Skilled traders watch all the charts to assist them in identifying characteristics that can assist them in understanding price moves, key support/resistance levels, and price patterns. This IWM chart should be on everyone’s radar at the moment. Where the IWM finds support, so will the other US stock market indexes.
The IWM setup indicates we may only see a 5~7% downside price swing before support is found. We’ll have to watch how this plays out over the next few weeks/months to determine if the $144.25 level is true support or if the lower $137.00 level will become support. Either way, the downside price swing appears poised to unfold over the next few days/weeks – so be prepared.
Please take a minute to visit www.TheTechnicalTraders.com to learn how we can help you find and execute better trades in 2019. We have already positioned our clients for this move and we believe we can help you stay ahead of these markets.


TNA longLong TNA from $53.30 (full position) Reversal day yesterday signaled short term low and closed with a tail candle, today we are retracing the tail. Nice buy setup.

SPY 4 Hour Official 2 month outlook (Bullish)It just came to me like the last one did. Visualized it

SPY daily Updated Study The angles are very similar and the first half of the year wedge seems to be a good indicator for price movement. Will see how the year ends. It's been fun everyone!

SPY hourly Fib Study within the Channel 50% retrace lets see what it does once it gets to that point. I would think we fall once more and bounce around 261 possibly next week to start the "Santa Rally" in Decmeber