SPY Short term Prediction30 min chart showing patterns and support levels and what i believe will be an overall fake out for the bears once more...
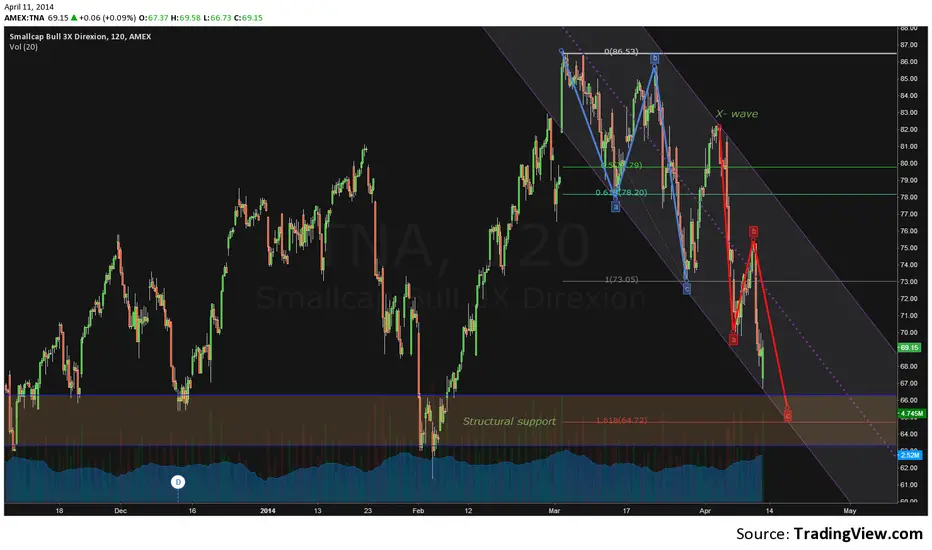
TNA


SPY Weekly 30 Years overall Look #BigPicture #MeasuredmoveThis is a carefully crafted study! I have demonstrated the angles that we will likely see in the future based on what we have seen in the past. Details in the chart... Hope to get 1K views on this


SPY Weekly Chart Bounce Coming soon This Chart compares patterns and bull flags (2012 and 2018). They look very similar! Cheers!

RTY Russell 2000 Futures LongThe small caps have been killed but I think we may be in for a nice bounce targeting the 1590 area for 30 point upside.
Directional Bias: Long
Price Target: 1590 on RTY Futures
Good Entry: 1548-1555
Risk/Reward: Max risk of 10 points/30 point reward.


RUT moves down as expected and is not ready for bottoming yetOn a micro level Russell needs five waves down off the top made at 3 PM last Friday. So far it reached the bottoming area for the micro wave ( iii ) down.
That means that after corrective a-b-c shaped move up it will continue moving down in direction of the green target box

Russell - decline into 1,470 may complete the correction The decline off the January 2018 low is shaped as ABC.
We are in the final leg C down.
The drop to 1,470 area may complete all of the Wave C down and consequently the whole correction off the top in January 2018.
Or it could be just the wave ( iii ) of that wave C. That scenario would imply a corrective pullback up in the wave ( iv ) up and then another drop to new lows in the wave ( v ) of C.

IWM: expecting some up action with the Russell 2000Intermediate up trend broken broken on the dialy log chart. Have a gap to close above. Of course not sure how high it will go before the next fall.

$TNA W,DW: Bearish Div. behind, w/ TP touched, RSI poised to cross up 50 and to confirm nw uptrend
D: overlap between wkly suppt and dly rebound for validation of Bullish DIv., back to the wkly target
Over dly target, following trend w/ fibo for next tp

Short term f/u on IWMThe triangle consolidation idea seems to be working out. See link below for longer term charts.


Sentiment Timing - DEC/4/2015 - THIS DROP WAS COMING The Sentiment on 12/2 was 93% Bullish. As I noted: “In general it is never a good idea to Buy on High Sentiment.” We have seen that every extreme cluster of Low Dorsey Sentiment have been ideal time to Buy zones. However, it is little recognized that “High Sentiment and Low sentiment are materially different in that they represent different aspects of the Emotional Market Brain.” The 5% Bullish on Thursday has been followed by 2% Bullish today after yesterdays’ dramatic declines. Stocks are trying to recover this morning and that may continue to some extent. However if the market remains relatively weak and there is low Sentiment on Monday, it could register a MEMBERS ONLY Negative Sentiment Cluster and fit with the profile for declines into MEMBERS ONLY time zone. However, given that the Price High and Key Reversal from the 93% is only, “ MEMBERS ONLY ,” the best profile resolution is for generic weakness to persist into MEMBERS ONLY . There is overt and obvious support down to the MEMBERS ONLY level. Thus it may yet turn out that this profiled hiccup is still just more Range Trading. The interesting idea that I provide is that there are short term profiles within the longer time frames that most investors are focused on and/or seduced by. There are high probabilities profiles that don’t require long winded cognitive rationales.
I had surmised that the “Seasonals would NOT be typical this year.” After this downside surprise, there is due to be an MEMBERS ONLY and then perhaps another MEMBERS ONLY into year end. Let’s take it one trade at a time. I repeat: “Thus, this is not the time for Big Bets and Out-sized trading positions.”
.Don't be on the wrong side!!!! click on the link below to see what Woody Dorsey has to say and if you want more information
www.sentimenttiming.com

S&P CyclesFrom the past two appreciable declines in 2001 and 2008, there appear to be some trend lines worth watch, in case current price action follows similar patterns.

TNA Short Opportunity Setting UpTwo very strong resistance cues:
(1) you have the former support turned resistance line
(2) you do not have a lot of room for price to advance if it does poke through the resistance line
Here is what I am looking for:
(a) price to breach resistance line to the upside
(b) price to pop aggressively above the upper daily bollinger band
(c) harvesting of the late exuberant bulls before a significant decline

TNA Bullish for the next few weeksYou could have added to longs with your earnings this way. Bullish fundamental outlook for the next few weeks for stocks. Here's a low risk entry to go long with a tight stop.

TNA abcd in speA quick chart for TNA...abcd could be in the cards.
Has retraced a 61.8 and bouncing.
I'm early in on 1st long position
Safe trading Ladies & Gents
BM
After posting chart: ( The fib should have been at the exactly top - then a perfect spot on 61.8 retrace could be seen)

Double zig zag done? Looks like a double zigzag is in the cards ... but could go lower for the 1,168 fib for completion. A capitulation flush and then a strong bounce up. But i'm hesitating to go in for more than a scalp here. Monday could be the day of good timing after a friday sell off before close.
Time will show
Safe trading here ladies and gents!
BM