10yr note % yield goes down after rate hikes? I'm confused. Please someone explain why the 10yr note yield TNX goes down after FOMC raises interest rates? I would expect the relationship between the two to be pretty much linear.
TNX


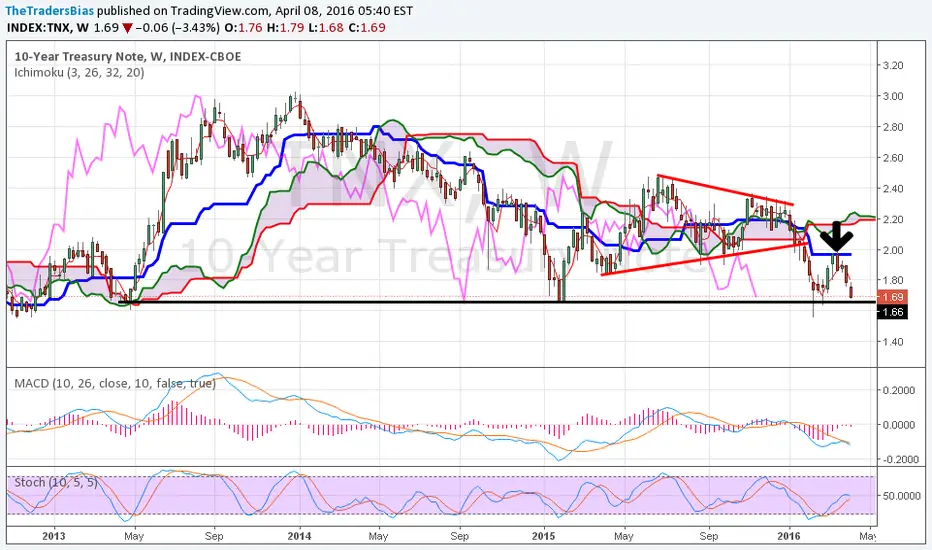
TNX: Nice PennantTextbook consolidation as we wait for more signals from the FOMC. Fed futures showing no hike in March but two hikes by December, expect another leg up once subsequent meetings start pricing in. Good time to scale in.

interest rate is the keywe will reach zero and gold will fly but for now bet the farm on shorting gold and buy bonds is maybe early. if we touch the blue line i think it wll be a good place to try it

Long Term Macro Outlook (M, Log Scale)Attn: Chart is in Log Scale.
A quick analysis of long term market outlook with historical context since 1970's. Not all recessions are covered, only those with -30% or more drop.
For additional references, I have included the TVC:TNX (Blue Line) and FFR (Black Line).

Gold looking to test 1250Today we got further confirmation of a golden-cross with gold, and even though we had a slight hiccup intra-day spurred by a USD bond sale, we closed above 1240 and made new highs for this run.
TNX is struggling to maintain above water, and it's RSI has been trending down since it's run up in November. We could potentially see a death cross as it's 5EMA makes it's way through it's 50EMA. Once it breaks trend I'm expecting a waterfall here, and the MACD is supporting this notion.
I'm not going to change my mind on my bullishness of gold as long as these technical factors remain in place. I will sell as soon as the climate changes, which may not be for a little while.


Something's got to giveThe DJI and SPX have been picture of clam for last month or so. But other markets are giving some very interesting cues. We could be in for some very interesting movements in a week's time when the Trump inauguration happens.
All the details around this would make this post very long.
I have the detailed rationale posted at trade-360.com

Economic cycle, market cycle, interest rates, trend lines & SPXThis chart provides probable market behavior given current market behavior, interest rates, and other factors such as presidential elections.
www.tradingview.com
I am expecting a down turn during the next week which would last until late February and another leg up in SPX until the final move down in August 2017.
Trend line colors mark the same conditions on both cycles.


tnx tow way for a same goalwell the way to go to the lise seem to be different , orange and blue but we will hit the red line.

tnx seem to be in a descending triangle despite of the trump illusion, we shoud see the big reality comme back

Bottom in yields is in, 3% by end of 201710-year Treasury Note yield (TNX) is going to climb towards 3% by Q4'17.

Inflation really here?TNX has been rising very rapidly. Now it's above 200-daily moving average. RSI is signaling overbought, but one must remember that it can stay overbought for some time.
Maybe investors are realizing something?
twitter.com

Shorter term bearish on the TNX with a longer term bullish viewWe like the short side of the 10 year treasury note for a bearish move to the 1.59 level as a target. Price action could continue higher to 1.73 from current levels, but the 1.59 should be achieved before a longer term bullish move is sustained. So on the longer term scale, we are bullish for price action to make a move for the 2.11 level, which could be reached by year end 2016.

US 10-year yield at major crossroadsThe TNX should be watched very closely next week as the daily chart currently indicates a high risk of seeing another bond rally in the wake of the latest US employment figures (which weren't all that bad). If doubts over a possible Fed rate hike towards the end of the year strengthen in September, the 10-year yield could fall back to it's historical lows, reached earlier this summer. This trade setup currently suggests that so long as the TNX trades sub 1.65%, bond prices are likely to rebound in September. The other scenario would consist in prices breaking support, perhaps in the wake of hawkish comments by FOMC participants, leading to a new period of rising rates similar to that which we saw in 2013 and 2015.


Next Stop 4%TNX appears to have ended its 3 wave decline. If 3 hits the common 1.618 multiple of 1 expect TNX at 4.23 before its next significant correction, which will end above 3.0, the top of wave 1 and then likely equal the ascent of 1 for wave 5...
Long TNX, short bonds...

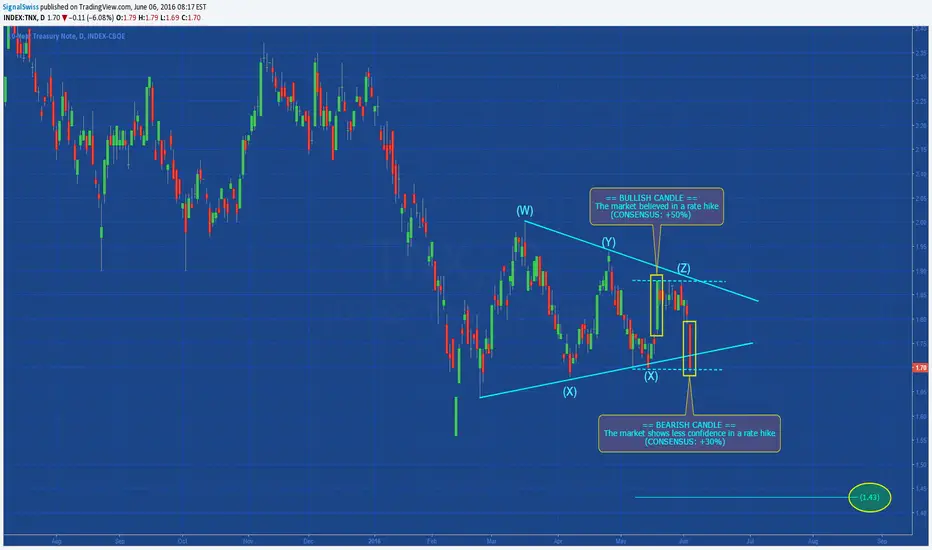
WAITING FED DECISION (T-NOTE)Today, the main event is likely to be a speech by Fed Chair Yellen before the World Affairs Council of Philadelphia, where she is expected to speak about global conditions. Given that Yellen already expressed her view on rate hikes last week, when she said that a hike “would probably be appropriate” in the coming months, we don’t expect any significant deviation from that remark. She is most likely going to reiterate that rate increases may be warranted in the near-future depending on the quality of incoming data. Following the very soft employment report for May though, we believe that the likelihood for a summer action has declined notably and thus, we will maintain our view that June may be too early for the Committee to act. If you trading eurusd, this analysis may be useful....
The effect NFP released Friday about eurusd:
(Click and Play)
We hope that our analysis can help you in your trading, if you think that our work has a value, support us with "I Like" button ... thank you very much!!
SignalSwiss
TRADING ROOM: www.nonsolotrading.com
DXY Rebound from 93.8 - Expecting Fed to Maintain 10Y Bond FloorI see overwhelming amt of negative press in the media regarding no chance of a Fed rate hike however I feel that most are overlooking the other supporting factors for a potential increase in Dollar Strength in the short term.
I am fundamentally biased to believe that the fed will be maintaining the 1.7% bond floor for reasons concerning economic stability and limitation of capital outflows from the US debt market (in order to sustain fiscal deficit for as long as possible before corporate earnings get too bad).
-BOJ indicates that it does not want to see the Dollar going any lower vs the Yen and I expect Yen to have a significant retrace after the extreme volatility seen in the past 2 months.
-Crude/Brent at a very high historical zone of resistance, expecting retrace along w/ UCAD following suit.
-Cable and Fiber seemingly unstable sentiment for the next few weeks especially with the latest Brexit polls out.
Best of luck!!

TNX weekly to test supportThis TNX weekly chart is very interesting. The bond market is not seeing a rate rise coming any time soon. Certainly it seems not sooner than June. I doubt it even then. See what happens when it gets to support.