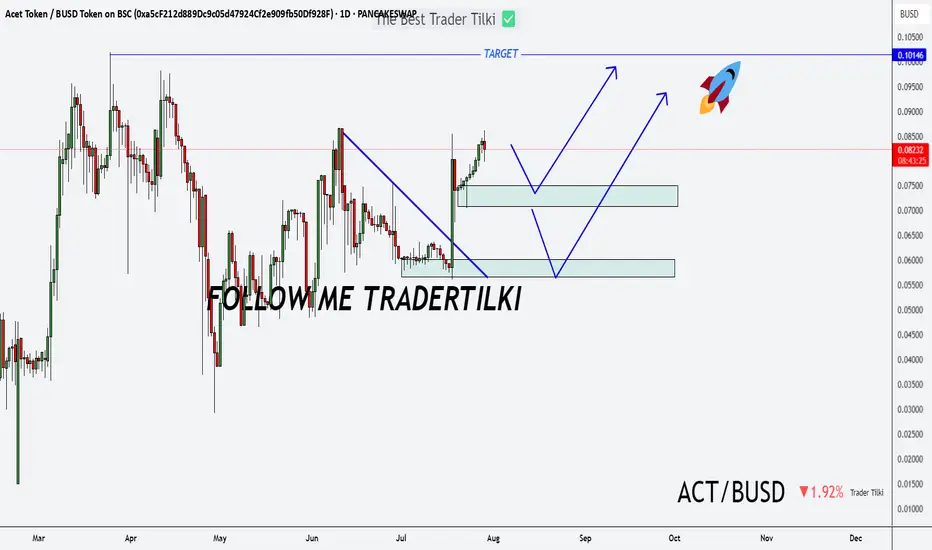
Act Bust on My Radar: Long-Term Vision, Short-Term Target!Hey folks 👋
I’ve put together a solid analysis for a promising token: **Act Bust**.
Whether it hits my entry level or not, I’ll be holding this token long-term.
Right now, the target is set at **0.10146**—once we get there, I’ll update you all.
Stay tuned, and trade smart 💼🚀
Token
INJ - Back Bullish!Hello TradingView Family / Fellow Traders. This is Richard, also known as theSignalyst.
📈INJ has been overall bullish trading within the rising wedge pattern marked in blue.
This week, INJ has been retesting the lower bound of the wedge.
Moreover, the green zone is a strong demand.
🏹 Thus, the highlighted blue circle is a strong area to look for buy setups as it is the intersection of the lower blue trendline and green demand.
📚 As per my trading style:
As #INJ approaches the blue circle zone, I will be looking for trend-following bullish reversal setups (like a double bottom pattern, trendline break , and so on...)
📚 Always follow your trading plan regarding entry, risk management, and trade management.
Good luck!
All Strategies Are Good; If Managed Properly!
~Richard Nasr

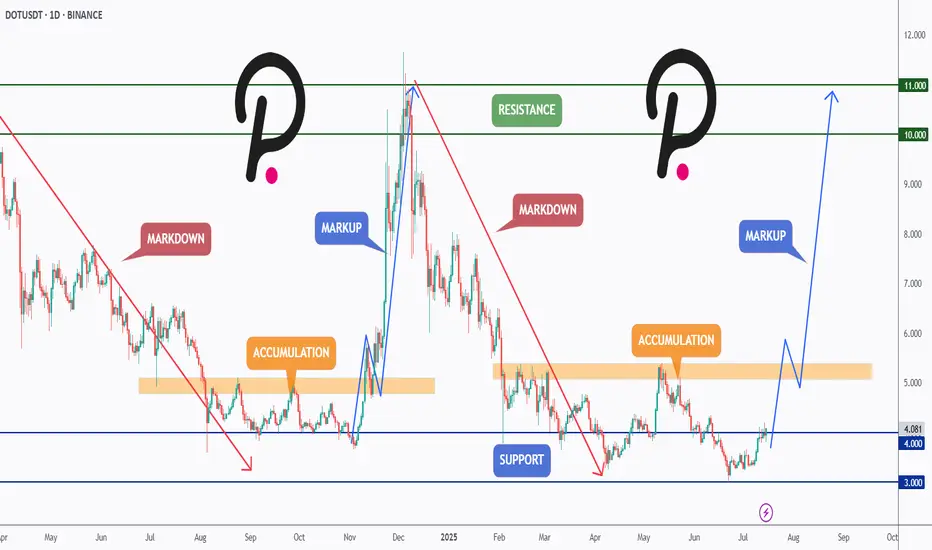
DOT Reloading for Takeoff ?CRYPTOCAP:DOT has been following a textbook Wyckoff cycle — moving from markdown into accumulation, followed by a sharp markup, then another markdown, and once again settling into a fresh accumulation zone.
After retesting the major support at $4 and holding above it, DOT is showing early signs of bullish momentum. If this structure continues, we could be preparing for another markup phase with potential targets at the $6, $10, and even $11 resistance zones.
This setup mirrors the previous cycle — will history repeat itself?
📍 Key Levels:
Support: $4.00 & $3.00
Resistance: $6.00, $10.00, and $11.00
Let me know your thoughts in the comments 👇
📚 Always follow your trading plan regarding entry, risk management, and trade management.
Good luck!
All Strategies Are Good; If Managed Properly!
~Richard Nasr
TOKENUSDT Forming Bullish WaveTOKENUSDT is currently displaying a promising bullish wave pattern that is catching the attention of traders looking for steady and reliable gains in the crypto market. The pair has shown consistent volume, indicating strong market participation and growing investor interest. While the expected gain of 10% to 20% may seem modest compared to some high-flying altcoins, this setup offers a more stable opportunity for those who prefer lower-risk trades with a clear technical structure.
The current price action suggests that TOKENUSDT is forming higher highs and higher lows, which is a classic sign of a bullish wave continuation. Many traders appreciate this pattern for its clear entry and exit levels, making it easier to manage risk and lock in profits. As the crypto market remains volatile, having a well-structured pair like TOKENUSDT in your watchlist can help diversify your trading portfolio and balance out more aggressive plays.
With a healthy support zone and steady upward momentum, TOKENUSDT has the potential to break through minor resistance levels and deliver the projected gains in the near term. Investors should watch for confirmation candles and spikes in buying volume to validate this bullish scenario. This crypto pair’s relative stability and clear pattern make it an appealing choice for swing traders and trend followers alike.
✅ Show your support by hitting the like button and
✅ Leaving a comment below! (What is You opinion about this Coin)
Your feedback and engagement keep me inspired to share more insightful market analysis with you!

TOKENUSDT 1D AnalysisTOKEN ~ 1D Analysis
#TOKEN This is the lowest support for now. Buy gradually from here with a short term target of at least 15%+ from this support.

Monthly Candle volatility growthThe market remains extremely sluggish in the seasonal flat, but there is a possibility of increased volatility this week and next. In this regard, I would like to consider the market situation and the likely prospects. First of all, in the medium term, the probability of a flat of about 100k for bitcoin and 2500 for ether prevails until the opening of the new half-year. There are no sufficient arguments for a significant break and trend towards 210k for bitcoin and 5k for ether. In addition, strong statistics for the United States began to be released, which increases the likelihood of a retest of 1900-2100 on ether and 85-90k on bitcoin. That is, until August, I am still more likely to expect a flat of 95-110k and 2250-2750 under an optimistic scenario. With a more negative picture, there remains the possibility of a major drawdown of the market until the retest of the loyalties of the first quarter on the tops.
A significant spike and bullish trend may be facilitated by the cancellation of Trump's duties voluntarily or in court, a truce in Ukraine, or the consolidation of brent above $ 69-70 while maintaining growth. In the event of a resumption of duties or a collapse of oil below $ 60, the probability of a fall in the crypt will become extremely high.
Against the background of the closing of the last bullish monthly candle and above 2500 on ether, we have technical signals for continued purchases. This week, there is a possibility of a major wave of purchases in the first half of the month with an attempt to move. However, strong US statistics are likely to continue to dampen growth attempts. Starting next week, it is worthwhile to carefully consider the volume of positions in the work due to the high probability of a market drawdown in the second half of the month. At the end of the week, I will assess the probability of maintaining purchases in the second half of the month, depending on the statistics released this week and the dynamics of oil.
To date, I am still considering the most oversold coins for scalping that have not been assigned the chess fio adx monitoring tag with possible growth waves of up to 70-100% from current levels. Fan tokens with a growth potential of up to 100-200% remain in a highly undervalued position, among which I work with atm acm city porto Lazio alpine juv. For storing funds in the medium term, quick looks interesting with the main long-term support at 0.020-21. The cos slf data pivx token can also show growth waves of up to 30-40%.
As I wrote earlier, large-cap coins, against the background of a seasonal flat and likely sales, may continue to fall slowly until August, in the absence of major growth in the tops or the index of dominance of altcoins.

XVG - Privacy is Important!Hello TradingView Family / Fellow Traders. This is Richard, also known as theSignalyst.
📈XVG has been overall bullish trading within the rising channel marked in blue and it is currently retesting the lower bound of the channel.
Moreover, the red zone is a strong structure.
🏹 Thus, the highlighted blue circle is a strong area to look for buy setups as it is the intersection of structure and lower blue trendline acting as a non-horizontal support.
📚 As per my trading style:
As #XVG approaches the blue circle zone, I will be looking for bullish reversal setups (like a double bottom pattern, trendline break , and so on...)
📚 Always follow your trading plan regarding entry, risk management, and trade management.
Good luck!
All Strategies Are Good; If Managed Properly!
~Rich

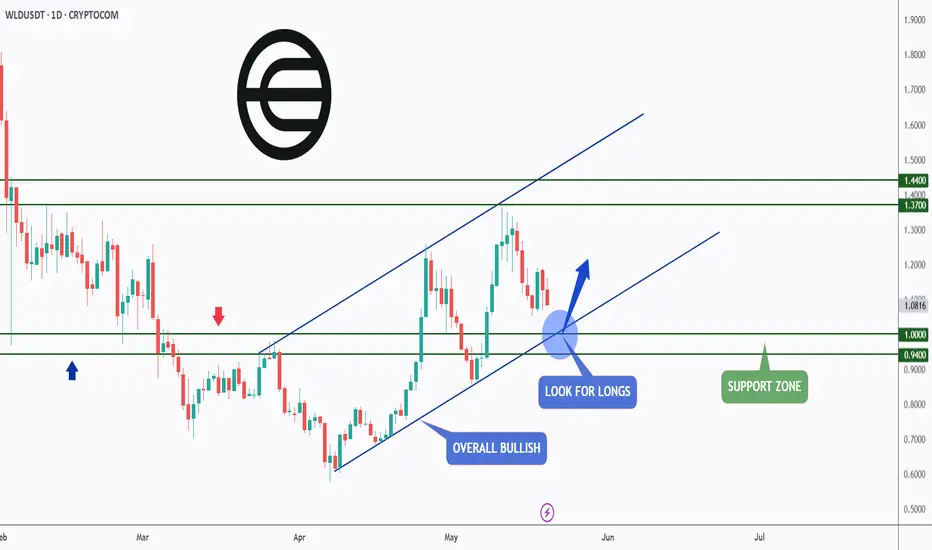
WLD - AI Cycle Is Back!Hello TradingView Family / Fellow Traders. This is Richard, also known as theSignalyst.
📈WLD has been in a correction phase. However it is still overall bullish long-term trading within the rising channel marked in blue.
Moreover, the green zone is a strong support and round number $1.
🏹 Thus, the highlighted blue circle is a strong area to look for buy setups as it is the intersection of support and lower blue trendline acting non-horizontal support.
📚 As per my trading style:
As #WLD retests the blue circle zone, I will be looking for bullish reversal setups (like a double bottom pattern, trendline break , and so on...)
📚 Always follow your trading plan regarding entry, risk management, and trade management.
Good luck!
All Strategies Are Good; If Managed Properly!
~Rich

XRP is Back!Hello TradingView Family / Fellow Traders. This is Richard, also known as theSignalyst.
📈XRP has been overall bullish from a medium-term perspective trading within the rising channel marked in blue.
Moreover, the green zone is a strong structure!
🏹 Thus, the highlighted blue circle is a strong area to look for buy setups as it is the intersection of structure and lower blue trendline acting as a non-horizontal support.
📚 As per my trading style:
As #XRP approaches the blue circle zone, I will be looking for bullish reversal setups (like a double bottom pattern, trendline break , and so on...)
📚 Always follow your trading plan regarding entry, risk management, and trade management.
Good luck!
All Strategies Are Good; If Managed Properly!
~Rich

(PLUME) plume "new to kraken - secret"I noticed Plume became new to kraken but did not appear at the top of the newly listed tokens. Here is a post to share the information briefly about the plume token which I did not know of previous to today.

XRP on the go!Hello TradingView Family / Fellow Traders. This is Richard, also known as theSignalyst.
📈 Medium-Term: XRP has been in a correction phase trading within the falling wedge marked in red.
📍 As it retests the lower bound of the channel — which perfectly intersects with the orange demand zone and the $1.5 round number — I’ll be looking for short-term longs.
🚀 For the bulls to take over in the long term and kick off the next bullish phase, a breakout above the red structure at $2.26 is needed.
Which scenario do you think will happen first — and why?
📚 Always follow your trading plan regarding entry, risk management, and trade management.
Good luck!
All Strategies Are Good; If Managed Properly!
~Rich

btcusd weekly analysis.weekly outlook in my opinion by year 2030. not financial advice
2025-2026 >>> 150-175k
2029-2030 >>> 265-290K

TOKENUSDT 1DTOKEN ~ 1D Analysis
#TOKEN Buy after successfully penetrating this resistant line with a short -term target of at least 10%+ from here.

Ondo Following The Macro TrendA New Era of Financial Inclusivity, Onchain🔗
#ONDO is rejecting the lower bound of its macro trend!
For the bulls to take over in the long term and kick off the next impulse move, a breakout above the $1 round number is needed.📈

LTO - Two Potential Longs!Hello TradingView Family / Fellow Traders. This is Richard, also known as theSignalyst.
📚 LTO has been rejecting a massive weekly support and the key $0.02 round number.
🛡️ As long as this level holds, I'm eyeing a potential 5x move towards the upper bound of the falling channel and the $0.10 round number.
🚀 From a macro perspective, a break above $0.10 could trigger a continuation towards $0.30 — unlocking major upside potential!
📚 Always follow your trading plan regarding entry, risk management, and trade management.
Good luck!
All Strategies Are Good; If Managed Properly!
~Rich

CRO - Building Block!Hello TradingView Family / Fellow Traders. This is Richard, also known as theSignalyst.
Let’s keep it simple!
📈 Short-Term Bullish:
CRO is currently hovering around a key weekly support level. As long as the $0.07 support holds, we can look for short-term long opportunities.
With bullish momentum picking up, the next target/resistance is around $0.11 (marked in blue).
🚀 Long-Term Bullish:
For the bulls to fully take control and aim for the next major resistance at $0.163 (marked in red), a confirmed breakout above the $0.115 level is needed.
📚 Always follow your trading plan regarding entry, risk management, and trade management.
Good luck!
All Strategies Are Good; If Managed Properly!
~Rich

S - Roadmap to $1S has been overall bullish trading within the rising channel marked in blue.
Currently, S is retesting the upper boundary of the channel and a key structure at $0.63.
For the bulls to stay in control and aim for the $1 round number, a break above $0.63 is needed.
In the meantime, if S retests the lower boundary of the blue channel and the $0.50 round number, we will be looking for trend-following long opportunities.

REZ - Bullish Indeed!Hello TradingView Family / Fellow Traders. This is Richard, also known as theSignalyst.
📈REZ has been in a correction phase and it is currently approaching the lower bound of the its rising green channel.
Moreover, the red zone is a strong demand.
🏹 Thus, the highlighted blue circle is a strong area to look for buy setups as it is the intersection of a demand zone and lower green trendline acting as a non-horizontal support.
📚 As per my trading style:
As #REZ approaches the blue circle, I will be looking for bullish reversal setups (like a double bottom pattern, trendline break , and so on...)
📚 Always follow your trading plan regarding entry, risk management, and trade management.
Good luck!
All Strategies Are Good; If Managed Properly!
~Rich

TOKENUSDT 2DTOKEN ~ 2D Analysis
#TOKEN Buy gradually from here if you still have a Conviction on this coin with a short -term target of at least 15%+.

NEAR - Bullish Movement Soon!NEAR has been overall bearish from both long-term and short-term perspectives, trading within the falling channel marked in red.
However, it is currently hovering around a support level, the lower trendline, and the key $3 round number, so we will be looking for longs on lower timeframes.
For the bulls to take over in the short term, a break above the last minor high at $3.025 is needed.
For the bulls to remain in control in the medium term, a break above the $3.65 major resistance is required.
Disclaimer:
This content is for informational purposes only and should not be considered financial or investment advice. Always do your own research and consult with a professional before making any investment decisions.

LINK - Wait For The Bulls!Hello TradingView Family / Fellow Traders. This is Richard, also known as theSignalyst.
📈LINK has been in a correction phase trading within the falling blue channel and it is currently retesting the lower bound of it.
Moreover, the blue zone is a strong structure and round number $15.
🏹 Thus, the highlighted blue circle is a strong area to look for buy setups as it is the intersection of structure and lower orange trendline acting as a non-horizontal support.
📚 As per my trading style:
As #LINK approaches the blue circle, I will be looking for bullish reversal setups (like a double bottom pattern, trendline break , and so on...)
📚 Always follow your trading plan regarding entry, risk management, and trade management.
Good luck!
All Strategies Are Good; If Managed Properly!
~Rich

Get Her ROSE for Just 4 Cents This Valentine!Hello TradingView Family / Fellow Traders. This is Richard, also known as theSignalyst.
🌹Instead of spending tens of bucks on a few roses this Valentine’s Day, get her hundreds of ROSE tokens—she'll thank you later!
📈ROSE has been overall bearish trading within the falling blue channel and it is currently approaching the lower bound of the channel.
Moreover, the $0.03 - $0.05 zone is a strong support.
🏹 Thus, the highlighted blue arrow zone is a strong area to look for buy setups as it is the intersection of support and lower blue trendline acting as a non-horizontal support.
📚 As per my trading style:
As #ROSE approaches the intersection zone, I will be looking for bullish reversal setups (like a double bottom pattern, trendline break , and so on...)
📚 Always follow your trading plan regarding entry, risk management, and trade management.
Good luck!
All Strategies Are Good; If Managed Properly!
~Rich
