LOOM digital Token....Is loom making another height?
Expect any thing from tokens ..
they can make you or break you.. lol
you should know when to exit ..
invest wisely!
all trading carries high risk!
HAppy trading :)
Token

VeThor Token | UnderratedWhat. A. Week. Instead of patiently waiting for an altseason , we are experiencing imo; an allseason ! Insane gains for lots of cryptocurrencies, where today a couple of my favorites had great double-digit gains: $VET & $VTHO. Instead of posting another VeChain chart, I thought it was good to highlight VeThor Token for this time, as a lot of $VET investors tend to overlook $VTHO.
For the ones who don't know, VeThor Token (VTHO) is the secondary token of the VeChainThor ecosystem and functions as the gas for transactions (Binance Research, 2020). It means that VeChain Thor (VET) is the native token for the platform, while VeThor Token (VTHO) plays an essential role in the overall functionality of the blockchain (CoinMarketCap, n.d.). $VTHO is needed for every transaction on the blockchain, to run & maintain dApps, and usage of $VET smart contracts (Bitvavo, n.d.). So, think of this: if you invest in $VET, why not in $VTHO? If VeChain's price surges, VeThor Token will go along with VeChain's gains because of the transactions. In addition, $VET generates $VTHO, which means if you HODL $VET you will earn VTHO by staking, which can be used to pay for your transactions (VeChainInsider, 2019). Sounds great to me ;). Good thing to know is that 70% of $VTHO paid in each transaction will be destroyed, while the rest is awarded to the 'Authority Masternode Operator' (a server that is connected to the network operating the VeChainThor software), who validate and process blocks for the transactions (VeChain, n.d.).
As $VET is showing lots of potential, I think this token is underrated as of this moment. According to CoinMarketCap, we saw 125%+ gains for $VTHO in the past 7-days. At January 18th, $VTHO had a high of $0.002 followed by a 'cooling period'. But in that particular period, we could see a bullish Gartley pattern while having higher-lows at all times. For now, it is totally understandable to have some bearish momentum, as investors are securing their profits. But for the longer-term, these two are looking very bullish to me.


$EWT Parabolic Soon????$EWT chart is setting up very nicely. Looking to close the weekly candle about the pointed out resistance. If we are able to close the week above the line. Look for EWT to go into price discovery mode and pump hard. Energy sector has been heating up around the world all year. Yet the blockchain energy sector has yet to pump. Let's see.
NOT FINANCIAL ADVICE

HUOBI TOKEN HEADED FOR ALL-TIME HIGH?Looks like Huobi may be able to breakout of a long cup and handle pattern. If we can get a weekly close above the $6.20 mark I believe we will head to very near $9. Huobi as an exchange is phenomenal and they currently hold the second highest exchange rating via coinmarketcap (not based on volume but overall quality of the exchange). The utility of the token is very similar to Binance Coin. If Huobi is able to consistently grow its user base, then Huobi Token should grow right along with it. During the 2018 crypto bear market there were only 3 coins that closed the year positive (chainlink, BNB, and Huobi Token. In my opinion that makes Huobi Token a lower risk investment given the uncertainty of current market situations. I will be holding $HT long term.
Not financial advice. DYOR

GateChain Token allTime breakout - $GT $GTXHey frens
I just wanted to show u my fav chart of my fav native exchange token. I watch BNB, HT, LEO and GT, which all are about to breakout any moment or really sewn.
This one $GT is my winner of them also I have the feeling there is something incoming for all crypto exchanges and their assets.
Suprisingly even $HT performed better to me, then the notorious one $BNB, but for sure I have no idea for what $LEO is doing there.
Good luck for this coming event

EOS not filling the fuel?Gues what
this is the graph that i can tell.
EOS need more volume if want to flying a roket.
there will be more sideways for this pair at the moment.
but do not overlook.
Current price
rank 13
$3.57 USD (13.74%)
0.00018966 BTC (12.09%)

Uniswap a liquidity on ethereum 2021im just chart a pullback price for this crypto.
if u want to get in for now.. i would say a now..
wait for another pullback. and for correction.
Rank 15
Uniswap Price (UNI)
$10.60
17.09%
0.0003232 BTC
0.007873 ETH


NU got momentum, 40-100 Percent
Solid candle in 4 hours, break out above 0.235 then profit percentage up to maximum 100%.
Invest wisely. NU sometimes become too slow, However, it often greens if GRTUSD reds. so look both charts carefully.
*Trading carries high risk*
invest wisely.
Happy Trading.

DOTDOWNUSDT 28th DecHi traders
The Token price is moving in descending trend. In my opinion, if this Token can break the 1.719 support level the pair would move to the support trendline.
Please comment your opinions

Basic Attention Token / Tether (BATUSDT) Daily swing tradeHi
here is another BAT analysis based on different Fibs confluences which are retracment, projection, and extensions and TP zone is specified with Fib time Base
please comment me your opinions.
thanks

Yearn Finance YFI Analysis [ BTC + TOTAL + YFI / Jan-Feb 21 ]YFI BTC Targets on January and February
YFI - 114,200 / BTC - 120,000
Blue Faractal - Total from 10 Aug 2020
Blue Fibo (with 2 green) - TOTAL
Yellow Fibo (with 2 green) - YFI
2 Green Fibo - 685%, 881%
BTC - Market Cap
$752,112,934,038
YFI - Market Cap
$1,150,817,795
BTC - Max Supply 21,000,000
Blockchain - BTC
YFI - Max Supply 30,000
Blockchain - Ethereum

GOLD - XAUUSDGold had tested the support level and broke its corrective channel up.
Gold is ready to renew highs amid a weakening dollar and overheating of the US market.
I am sure that 2021 will be very bullish for gold.
Best regards EXCAVO

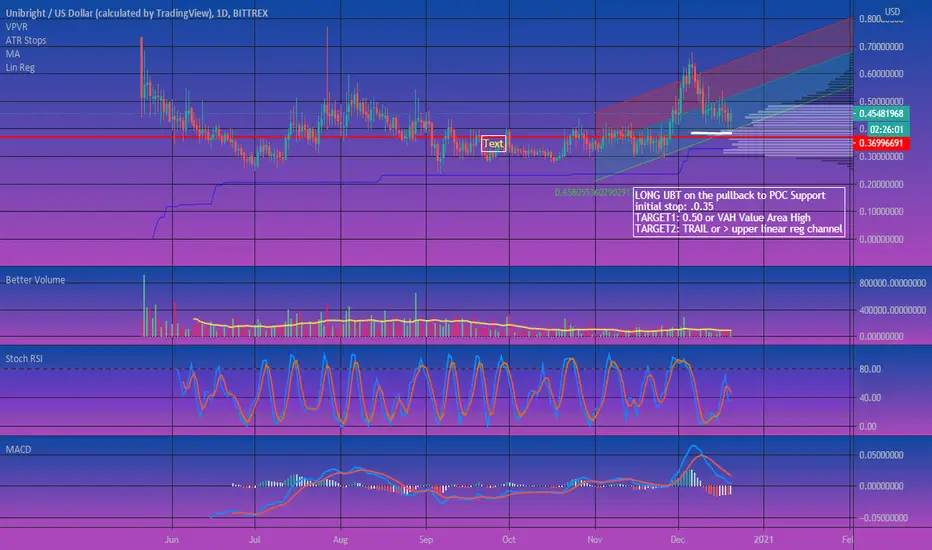
LONG UBT with stop and profit targetsLONG UBT on the pullback to POC Support
initial stop: .0.35
TARGET1: 0.50 or VAH Value Area High
TARGET2: TRAIL or > upper linear reg channel
==========================================
Unibright empowers business process specialists to enable a complete blockchain-based business integration lifecycle without having to be a coding expert. Unibright Token will be the only payment option to register Unibright conformant smart contracts. Only registered contracts can be published, maintained, and queried using the Unibright framework.

WOZX to the MARS!Salve
I bought $Wozex at 1 and now its 2.5
Its not a big deal, I'm not gonna sell it soon
the night still young, and we still on the moon
Steve is my hero and the project is the bad a$$ ONE
have a wonderful day
Ciao

SKLHey there
Miss Me??
well skl made 200% just after 2 hours listed on Binance
its 0.08 r8 now and 0.15 is easy target
so long

Basic Token Attention (BAT) - BAT are not BlindBasic token Attention (BAT)
well famous during the last crypto season.
fast selling during ICO.
Brendan Eich really doing his job devoping Brave Browser.
they intent to remove middle man
between the users, content creator, and ads.
this is one of the real crypto usage that are maintain to this date.
If you notice i am marking arrow up and roket.
arrow up=> price up.
Rocket => To da moon.
current price.
Rank 50
$0.258755 USD (1.49%)
0.00001369 BTC (-2.38%)
0.00043463 ETH (3.47%)

Chainlink on the LINKUSD view 2020Before im charting a chainlink against BTC,
this time compare with USD.
if u see the the price, there u see since
it born, the price is around peny. 0.03 USD.
during the hard time for crypto world, the only i see a great
climbing is chainlink.
Although its born from a token of etherium, but
it oracle base will connect between the real world and digital world.
Damnnn!!!! give me a like u like my chart.
Current Price
$15.02 USD (2.38%)
0.00080513 BTC (0.22%)
0.02550463 ETH (-6.27%)

ROSE ARE GREEN!Hola Amigos
I believe in ROSE and Oasis Network
and they launch their coin on Binance Cex yesterday
:) love yall
