[MCO/BTC] A GOOD CHANCE TO INVEST [ 75-100% POTENTIAL RETURN]#MCO / BTC ( Binance )
Buy Range : 0.00063-67
Stop Loss : 0.00059 ( Optional )
Target 1 : 0.0011273
Target 2 : 0.0013979
MCO against BTC/USD has back to the classical support. Last weeks price has stop bleeding and it has been closing green & sideways.
People is waiting for a clear bull signal to invest but we can see how sell pressure has already stopped giving us a good chance to buy and wait.
On short timeframes, we can see Ichimoku cloud has been broken while prices remains sideways and slightly supported by moving averages.
I think that could be the beggining for a reversal but maybe its a bit early to confirm it.
Daily dont offer much interesant info but we can see how MACD is getting better and Stoch RSI its moving up.
This coin represents a good chance to INVEST on it. if we consider that this support zone can be defended without problems, as a result my targets should be easy reacheable for mid/long-term.
Token

Ripple Looking Incredibly Neutral This price analysis will be dedicated to dissecting the future price action of the Ripple coin. This coin is probably one of the most highly anticipated and suggested coins in the T10, so we’ll make sure to take our time in dissecting this piece.
So, the chart above is from the last price analysis that we did with Ripple.
It has been re-posted above for convenience’s sake.
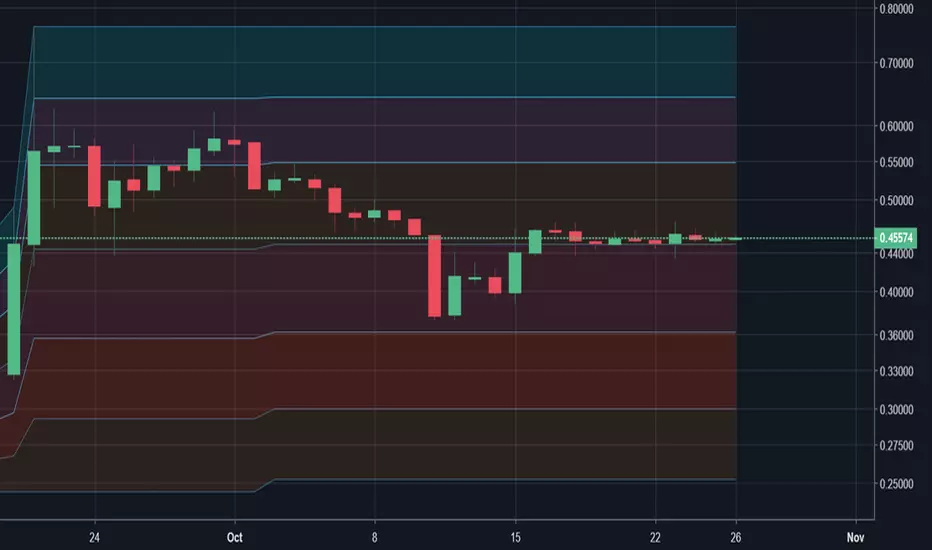
As noted in that chart, 43 cents has held as a very reliable support point for Ripple in recent memory.
There was a brief moment when the price of Ripple touched down around the 37 cent-ish mark before sharply bouncing back up to its current levels at 45–47 cents.
Currently, however, the price of Ripple has been trading along this support with relatively little to no price movement as it continues to consolidate :
Please keep in mind that the above charts were created on the daily resolution.
Now, let’s see what the price action looks like when we can move a bit lower in time to the 2-hour resolution (our favorite as of late for short-term analyses).
2-Hour Ripple $XRP Chart
The first thing that we’re going to do here is draw resistance and support points on the chart:
Here, we can see that there was a downtrend resistance that was broken around October 15th (when there was that random spike in the market; same day that Tether broke off of the peg).
The uptrend that was established from that point (after the breaking of that downtrend), has held ever since and the price of Ripple $XRP is currently nudging against it on the H2.
It’s worth noting that this support is not particularly strong or well-tested and that sharper market forces could easily eviscerate this particular support.
However, 43 cents, as mentioned earlier, is still a very reliable point that should be considered to be the most likely place that Ripple $XRP’s price would visit if it were to drop in price.
Using a close-up view, it appears that this mini-uptrend support has been preserved fairly well and that the most recent candle formation signifies a bounce off of the line, which would corroborate the idea that it serves as a valid support point.
However, the bounce has not been substantive and it appears that the price of Ripple is adhering heavily to this support point, which is bearish.
Let’s check out some other indicators though, shall we?
Relative Strength Index(14) for Ripple $XRP
As can be seen on the chart above, the RSI(14) is perhaps as ambiguous as the price data on this chart as well for the 2 hour.
However, the 4–hour data appears to be rock solid at this point in time.
Check it out below:
Moving Fibonacci Levels
This indicator does exactly what it says. It’s also a custom one that was built by the Zerononcense team.
Check it out below:
As noted in the chart above, the price of $XRP is currently floating directly above the Fib resistance level that’s located at 44.84 cents.
Conclusion
We’ll remain neutral for the time being This is one to be observed.
We’re slightly more toward the bearish side on this one, but it remains to be seen what will really happen with $XRP as time goes on.

KNC Long on This Accumulation PhaseTo be honest i can't say a lot of things here. I love the chart and indicator combination. Very low R/R level. KNC fundamentally is also great one. Kyber Network also has been listed in many big name exchange and good fundamental behind this token with only less than 220 mil total suppy and ranked #101 on coinmarketcap.com

$MFT Will Have a Correction. The Idea is Because...Quite good fundamental low sats on Binance along with Sia Coin and Pundi X.
Mainframe currently having 10 Billions of total supply and 2.5 Billions on the circulating and ranked as #211 on coinmarketcap.com. Right now the market cap is about $21 mills. Having a quiet good relationship with Ethereum developers and the team seem nice lately. Having an active social media exposure.
They describe themselves as: the platform for decentralized applications. Resistant to censorship, surveillance, and disruption, the Mainframe network enables any application to send data, store files, manage payments, run tasks, and more.
Mainframe is quite new to coinmarketcap.com as it started get listed on July. Newborn.
I think so far the fundamental isn't really that famous, but yeah will give it a shot.
From the chart judgement i really expect the price is not really going to blow, considering it's total supply is not really on the market, so yeah...
The support is on the green line, as the current moment this token's price is being oversold. Will go to the green line if only we break that yellow below. Otherwise we will some upwards movement towards 140 sats as it is the strongest resistance until today.
If you love the idea don't forget to give your comments and likes and sharing then follow me to support!
Trade safe!

My $1k to $100k Challenge: Day 79 - Trade #64 CDTHello all and thanks for stopping by and following my personal challenge. I am attempting to turn $1000 into $100,000 by day trading altcoins.
I started my challenge on July 14th with a bankroll of 0.16 Bitcoin that was valued at $1000 at the time. You can follow and see all my trades in my profile.
7 winning trades out of my last 10.
After 78 days and 61 completed trades:
Wins: 31
Loss: 30
Balance: 0.1939 B
USD: $ 1279
*Some trades may be pending and not yet included in my stats
There are too many trades to list. All my trades and stats for this challenge can be found in the link on my profile if you want to follow.
CAUTION: This challenge represents a small portion of my overall portfolio. To maximize the potential of reaching my 100k challenge goal quickly with just 1k, I am using most of my challenge bankroll per trade trying to build up my bankroll for the challenge.
If you are following me, I do not recommend this strategy, but instead you should limit your trades to max 2-4% of your portfolio per trade. Please trade smart.
Alright, here we go with Day 75 trade #63
I invested 0.10 B into CDT. I bought 42194 @ 237 satoshi
My Sell targets are:
T1: 250 5% potential profit
T2: 261 10% potential profit
T3: 273 15% potential profit
I will sell 50% at target 1. 25% at target 2 and 3.
If target 1 is hit, I will move my SL up to my buy in price.
If target 2 is hit, I will move my SL up to T1.
SL: 231 -2.5%
CDT is on an uptrend and this token loves to wick up. Momentum, the chart and indicators make this an easy entry.
In case you are wondering why my buy price sometimes doesn't match the current price on the chart when I make a new post, this is because I post my coin selection to my Discord group first and then make a new trade idea here which takes about 30 minutes to complete this all.
I am 100% transparent. I show screenshots of my buy price and amount on my Discord group. This has been a fun experiment and I enjoy sharing my journey.
If you agree, click the agree button.
Your comments are always welcome.
Thanks for stopping by and have a great day!

JUST IF I Pump $ELF, Do You Really Wanna Know Why?Decentralized Cloud Computing is the most make sense industry at the moment. It's also linked with many big companies wanted to achieve the same thing on the same project. Cloud computing is quite primadona at this time and maybe several years ahead. Name it, Alibaba, Google, Microsoft and many others which smaller also wanted to have a piece of cake of this sector audience.
Then, Decentralized Cloud Computing Blockchain Network sounds really good. Because it's probably the mid-term goal on top of it for now. And that's what aelf, or the ticker ELF, do.
It's not a surprise if you see their website is full of big partnership investors, I do agree with them. Plus point, their website looks pretty nice.
For real tho, aside of big partnerships, they are also listed on Exchanges like Bitfinex, Binance, Bithumb and Huobi. Top notch. Even tho there are several others on the list but these four are convincing enough for me.
What i don't really like is their percentage of token owners. Really giving a little space for the market. Of course this action really reasonable because they knew their quality. Hmm interesting...
Judgin from the fact that right now is on the accumulation zone. I bet a lot of capital right now trying to monopoly the market supply as we can see for weeks now. Just watchout. If you wanted to invest and accumulating for mid-term timeframe, you should pick something like this with proper entry.
Because you already read the major reason, why this stuff great and why I will pump it. But i need to collect as much as I can before attracting the prey to my trap, retailers, so i can gaining a lot fo profit as I can.
I think 5000 - 5500 is good accumulation range and if you got caught the price below 5000 sats then it's pretty big discount sale.
Trade safe!


LINK Needs to cooldown a bitLINK has pumped because it's rumor to get listed on Bithumb. Chainlink has 1 Billion Total Supply. Smart Contracts to provide the ability to execute tamper-proof digital agreements, which are considered highly secure and highly reliable. In order to maintain a contracts overall reliability, the inputs and outputs which the contract relies on also need to be secure. Chainlinks provide a reliable connection to external data, that is provably secure end-to-end.
My target on LINK cool down divided in three level which provide a safe buy zone among them in case something unpredictable happened. The cool down will be a result of RSI overbought. Looking forward to RSI level back around 50 -20 level.


SELL ONTONT price is on a bearish trend and the price is currently overbought according to the stochastic RSI. The bearish momentum is well confirmed by the recent cross on the stochastic RSI, and possible sell trade could be initiated as of the current price, around 0.0003161 satoshi, or wait for the price to cross the lower trend line on the triangular trend. Take profit target could be placed at the lower support, around 0.0002706 satoshi, with a stop loss around the downtrend trend line, around 0.0003233 satoshi.
ONTBTC

Downtrend will continue until November - $5,000 per bitcoinShort points for the next months
Downtrend will continue until November
Security Tokens will get into the game
The price at which most miners would really start shutting down their operations is around $3,000 to $4,000 per bitcoin
More institutional investors will get into bitcoin (end of September ETF)
The sell-off currently from investors, who last year piled into initial coin offerings (ICOs) and now getting out by empty promises / weak MVP.
Learn more about Security Tokens
chainsulting.de
What is Chainsulting ?
Chainsulting is a consulting and development company, on the subject of Distributed-Ledger-Technologie (DLT).
We show ways, opportunities and risks and offer comprehensive solutions.
Get in touch with us
chainsulting.de

Buyzone on BRD according to fib extensionShort play on BRD, along most altcoins atm. I like BRD project and i am willing to fill my bags above 4200 sat area, which is the continuation of the last downtrend movement


There is a trading opportunity to buy in BATUSDTechnical analysis:
. Basic Attention Token/Dollar is in a range bound and beginning of uptrend is expected.
. The price is below the 21-Day WEMA which acts as a dynamic resistance.
. The RSI is at 42.
Trading suggestion:
. The price is in a range bound and we forecast the uptrend would begin.
. There is a possibility of temporary retracement to suggested support zone (0.19 to 0.13). if so, traders can set orders based on Price Action and expect to reach short-term targets.
Beginning of entry zone (0.19)
Ending of entry zone (0.13)
Entry signal:
Signal to enter the market occurs when the price comes to "Buy zone" then forms one of the reversal patterns, whether "Bullish Engulfing", "Hammer" or "Valley" in other words,
NO entry signal when the price comes to the zone BUT after any of reversal patterns is formed in the zone.
To learn more about "Entry signal" and the special version of our "Price Action" strategy FOLLOW our lessons:
Take Profits:
TP1= @ 0.33
TP2= @ 0.39
TP3= @ 0.49
TP4= @ 0.69
TP5= @ 1.04
TP6= Free

I see an upwards trend forming, how about you?This summers hot little newcomer LOOM popped up in the top 100 out of nowhere. At least I haven't seen it coming so fast. After a contemporary decline, I see yet another uptrend forming. So I will keep my eye on this one for August. Looks to me like we will see it testing resistance at 0.00003816 for a third time. But whatever, still an interesting project.

A trading opportunity to buy is near in BATBNBTechnical analysis:
. Basic Attention Token/Binance Coin is in a range bound and beginning of uptrend is expected.
. The price is below the 21-Day WEMA which acts as a dynamic resistance.
. The RSI is at 38.
Trading suggestion:
. The price is in a range bound and we forecast the uptrend would begin.
. There is a possibility of temporary retracement to suggested support zone (0.01470 to 0.01270). if so, traders can set orders based on Price Action and expect to reach short-term targets.
Beginning of entry zone (0.01470)
Ending of entry zone (0.01270)
Entry signal:
Signal to enter the market occurs when the price comes to "Buy zone" then forms one of the reversal patterns, whether "Bullish Engulfing" , "Hammer" or "Valley" in other words,
NO entry signal when the price comes to the zone BUT after any of reversal patterns is formed in the zone.
To learn more about "Entry signal" and the special version of our "Price Action" strategy FOLLOW our lessons:
Take Profits:
TP1= @ 0.020
TP2= @ 0.024
TP3= @ 0.029
TP4= @ 0.033
TP5= @ 0.037
TP6= @ 0.052
TP7= @ 0.064
TP8= @ 0.076
TP9= @ 0.093
TP10= @ 0.115
TP11= Free

A trading opportunity to buy is near in BATBNBTechnical analysis:
. Basic Attention Token/Binance Coin is in a range bound and beginning of uptrend is expected.
. The price is below the 21-Day WEMA which acts as a dynamic resistance.
. The RSI is at 38.
Trading suggestion:
. The price is in a range bound and we forecast the uptrend would begin.
. There is a possibility of temporary retracement to suggested support zone (0.01470 to 0.01270). if so, traders can set orders based on Price Action and expect to reach short-term targets.
Beginning of entry zone (0.01470)
Ending of entry zone (0.01270)
Entry signal:
Signal to enter the market occurs when the price comes to "Buy zone" then forms one of the reversal patterns, whether "Bullish Engulfing", "Hammer" or "Valley" in other words,
NO entry signal when the price comes to the zone BUT after any of reversal patterns is formed in the zone.
To learn more about "Entry signal" and the special version of our "Price Action" strategy FOLLOW our lessons:
Take Profits:
TP1= @ 0.020
TP2= @ 0.024
TP3= @ 0.029
TP4= @ 0.033
TP5= @ 0.037
TP6= @ 0.052
TP7= @ 0.064
TP8= @ 0.076
TP9= @ 0.093
TP10= @ 0.115
TP11= Free

STORM coming like Storm !I'm waiting good moves from Storm. on Short Term
Target 1: 335
Target 2: 400
Thats not an investment advice, do your own research before invest.
Good Luck,
-YD

HT Token Launch Trade + Market Update (300%+ Potential)## Here is another opportunity that the market is preparing for us. These latest opportunities will take a shorter time to develop than most of our old calls. These will develop mainly between 2-4 weeks from now, some going for 8-12 weeks maximum as the goal.
I'll be mentioning on the trade details the time frame that I believe it is necessary for the trade to take off. As for the targets, use them as reference and collect your profits when we start to move up. Long term targets are available on detailed long term trade calls... As for the entire market...
**We are still in the uncertainty zone. The Altcoins are more ready than ever, the market has gone on a full retrace and the charts are building up giving out many buy signals for long term trades. But the question is this: Will the action start now or wait longer?**
**It all depends on Bitcoin -4.03% and Bitcoin -4.03% is on the "uncertainty zone", it is ready to make a move but the signals are bearish while the market is ready to move up (many mixed signals with more to the bearish side).**
**If Bitcoin -4.03% starts to move up, this can boost the whole market and a trend change can start. But if Bitcoin -4.03% drops, it can take another while.**
**Whichever scenario unfolds, we have consolidated long enough. A drop for Bitcoin -4.03% should be fast, if it happens, we are already close to the bottom and there isn't much run left for down, even if it hits again, it will be fast and we can try another run.**
**The market has been bearish for a while now... the time to buy again has come! So feel free to load up on all of your favorite altcoins, even Bitcoin -4.03% , using always a very tight stop loss in this case. For long term, just buy and hold, because the prices are pretty nice long term.**
___
> Introduction
> HT (Huobi Token(www.huobi.br.com is a blockchain-powered loyalty point system. It is the only token that Huobi officially launched. HT supports Huobi Global business and all products, such as VIP discount, HT exclusive events, trading against popular coins and "let your voice be heard".
**Issue Time** 2018-1-24
*Total Amount* 500,000,000
*Circulation* 300,000,000+
### Official Website (www.huobi.br.com)
#### Block Explorer (etherscan.io)
____
#### Getting back into the money... Here is another quick trade, (www.huobi.br.com), with very low risk and high rewards as well.
> (www.huobi.br.com) bounced twice from oversold line on the RSI daily time frame.
TRADE INSTRUCTIONS
Upcoming event:
Looking solid and building up. If the market moves positive, it will be a good great to be holding this and many other of the active and highly volatile altcoins, this can turn into nice profits shortly.
(www.huobi.br.com)
steemitimages.com
**Buy zone 2.86 - 3.1**
(1) 4.2
(2) 4.8
(3) 5.6
(4) 6
(5) 6.4
(6) 7
(7) 7.7
Stop loss: 2.83.2
Time frame: 2-5 weeks.
Note: The "time frame" reflects the time I believe this trade will take for it to start moving positive. This is for reference only and can change according to market conditions.
Enjoy the trade...
Official Website for buying (www.huobi.br.com)
Link Tradingview

THETA TOKEN / BTC- INVESTMENT opportunity // divergence in RSItheta token a coulto project among the big investors
closer could do a good rally
I'll make a video about this coin greetings
divergence in RSI
and areas of reversion
support area
*** Do not invest money you are not willing to lose **
capital management
risk management

Digibyte Technical Analysis - Strong Support + OVERSOLD!Goodnight traders!
Hope you are all doing fine!
I bring you here a coin that a hold long term, with still very high profits possible in the next bull run! If you dont know Digibyte go check it out!
Now lets talk about my daily trade,
We are looking at the 2HR chart of DGB, price is currently oversold, not only on the 2hr but with RSI 30 on the 4hr, so we can expect it to go up any moment!
Still dont forget that BTC is falling and that can take us even more down! But not too much :)
Buy zone is around my grey box, and sell/take profit zones are the green boxes on the Chart!
These are my first months sharing my knowledge with you guys, and all the support is welcome! I hope you like my work!
If you like my posts dont forget to leave a BIG like ;)
I will update this soon, when i reach 3 likes,
Mr.TTT
