AION Token looks ready to run without BTC AION Token has taking a beating like many other alts have over the past week.
Although BTC doesn't seem to be done dropping, AION indicators look strong.
Here is my trading strategy on Binance.
AION on Binance
Buy up to 35000
T1: 38500 10% profit
T2: 42000 20% profit
T3: 45500 30% profit
Stop Loss : 29750
Rating : 3 out of 5 stars
Volume 491 BTC
Token

What's Golem Up To These Days? • If 61.8 fib retracement is broken, a retracement to 78.6% is highly probable. If support at 61.8 fib is only bounced-off of, previous fib extensions show it going to .00008966 first and .00009638 second. When this will happen is still a mystery as market behavior and buyer sentiment should be gauged with caution.
• Another scenario is that GNT will remain moving sideways for a little bit along the highlighted area between the previous retracement'ss 61.8 fib level and the new extension's 23.6 extension before continuing on to its next impulse rally. Both of these levels have shown to be supports/resistances.
• Although 61.8% or .00007850 seems like a reasonable entry to go long, I would watch it closely as there is a good probability that the next fib level (78.6%) will be tested at .00007050. My own buy set-up will be broken down into gradual purchases.
• MACD is at one of its lower points in the course of the last 30 days which means a reversal should be in place soon. This should make the bulls optimistic and trigger happy.
Entry #1 = .00007835 (-61.8 FIB RETRACEMENT)
Entry #2 = .00007835 (-78.6 FIB RETRACEMENT)
Target #1 = .00008966 (+23.6% FIB EXTENSION)
Target #2 = .00009638 (+38.2% FIB EXTENSION)
Target #3 = .00010182 (+50% FIB EXTENSION)
Stop Loss = .00006095 (Channel Break)
***This information is not a recommendation to buy or sell. It is to be used for educational purposes only. it should not be considered financial advice***

OKSI CoiN - NEW CRYPTOCURRENCY EXCHANGEKSI Coin (oksicoin.com) is a decentralized WAVES token.
The main crowd project, which will be implemented at the expense of the proceeds from the sale of OKSI - a new, modern crypto-currency exchange (bitstels.com), which will have a number of significant advantages compared to the already functioning crypto-exchanges.
Advantages of future crypto-birzha (domain - bitstels.com)
- low commissions for transactions;
- low commission for input and output of funds and withdrawal of the crypto currency;
- absolute anonymity (trade without verification);
- Offshore servers;
- loyal support service that will respond to calls as soon as possible;
- trading only verified crypto-currencies;
- COMPENSATION PROGRAM for holders of OKSI COIN, which will be held at least once a year (more details can be read here - oksicoin.com)
Site - oksicoin.com

CRYPTO of the week: ZRXBTC 4H UPDATE - motive 5 wavesZRXBTC 4H UPDATE - 25/04/2018
9,715 held and 11,800 has been taken which opened the door for 12,992-13,484 with possible extension to 14,281 and bulls will have a line of bears at 13,598 as psychological price (I don't use them in my trading, but should not be ignored, especially when it is at equal leg area ;-)).
So, at the moment, cycle from 4,922 is mature with enough swings to the upside for a motive 5 waves. The right side is to the upside, but I won't buy this last leg for reason explained above and I would not sell either. I'll wait for a clear corrective 3 waves pullback where buyers should appear again. Need more data to propose levels.
Invalidation level to the upside is 4,922
Every week, for one particular cryptocurrency, in addition to the charts that I upload on TradingView, I will put the full comments and trade setup for different time frames:
- Daily on Sunday,
- 4h once a day during Asia session and
- 1h twice a day in Asia (post US) and Europe sessions.
This week 22/04/2018-28/04/2018, I propose ZRXBTC
Disclaimer :
This content is provided for educational purposes only. The Trader's Corner is not registered as an investment adviser and the information shared on the website or any other medium is not meant to be a solicitation or recommendation to buy/sell any instrument. Any trades placed based on our content are at the own risk of the viewer. Trading include risks and loss of capital. Future trading results can never be guaranteed.

CRYPTO of the week: ZRXBTC 4h for setupThe cycle from 19,234 high has been called ended at 4,922 low. The sequence to the upside suggests end of the cycle at 18/04/2018 high.
And while we have a marginal new high with RSI divergence, I cannot see the move from the low as a motive wave (even leading diagonal) so I have to go with the FLAT until I'm proven wrong (I really do not like to do that but dip to 9,715 do not make the case for a 4th wave anywhere in any sequence within this cycle.
Alternate view is red 1 on the chart is actually the correction of all cycle from 4,922 but I'd like to see a deeper correction here.
So, as I do not have any crystal ball, I will stay sidelined and see what can be done in lower time frame.
Plan would be to buy any clear corrective 3 waves above 4,922 but I won't chase or go heavy on this one because corrective 3 waves up is by nature corrective and bears could take control again.
Every week, for one particular cryptocurrency, in addition to the charts that I upload on TradingView, I will put the comments and trade setup for different time frames:
- Daily on Sunday,
- 4h once a day during Asia session and
- 1h twice a day in Asia (post US) and Europe sessions.
This week 22/04/2018-28/04/2018, I propose ZRXBTC
Disclaimer :
This content is provided for educational purposes only. The Trader's Corner is not registered as an investment adviser and the information shared on the website or any other medium is not meant to be a solicitation or recommendation to buy/sell any instrument. Any trades placed based on our content are at the own risk of the viewer. Trading include risks and loss of capital. Future trading results can never be guaranteed.

CRYPTO of the week: ZRXBTC 1h executionI might be totally wrong here and I would not trade the chart here, but as said earlier, I cannot see 5 waves from the top, so need to call a FLAT from 21/04/2018.
Either it is purple 4 or blue 2, I expect a 5 waves down from current levels (depth will resolve purple 4 or blue 2). This means that it will be difficult to buy lower as FLAT can extend as much as they like and we are not protected with a motive 5 waves to the upside from 4,922.
So this week will be interesting for education purpose to study specific structures and how to operate them.
Invalidation level to the upside is 7,037 and more importantly 4,922.
Invalidation level to the downside is 11,800.
Every week, for one particular cryptocurrency, in addition to the charts that I upload on TradingView, I will put the comments and trade setup for different time frames:
- Daily on Sunday,
- 4h once a day during Asia session and
- 1h twice a day in Asia (post US) and Europe sessions.
This week 22/04/2018-28/04/2018, I propose ZRXBTC
Disclaimer :
This content is provided for educational purposes only. The Trader's Corner is not registered as an investment adviser and the information shared on the website or any other medium is not meant to be a solicitation or recommendation to buy/sell any instrument. Any trades placed based on our content are at the own risk of the viewer. Trading include risks and loss of capital. Future trading results can never be guaranteed.

CRYPTO of the week: ZRXBTC Daily to set contextA cycle ended at 19,234 high on 27/01/2018 and since then we have seen a double correction ending exactly at equal leg area 4,765 where it bounced. So far, the outlook in daily is neutral but we have a motive 5 waves from 1,356 low which indicated that we will see another one. Assumption is 1,356 low was starting a new cycle.
I was long from 20/03/2018 in lower time frame but out (I have not been able to catch the equal leg in daily).
For now, sequence from 18/03/2018 low is called ended at 11,476.00 and marginal new high would be part of a FLAT (I don't like to call FLAT ahead of its confirmation, but I'll explain in 4h chart)
4,922 is my reference for support now but it is a soft support as long as we don't break above 19,234 or we have a bullish sequence in daily. So at current level, bears will probably jump in soon and we should have a reaction for a pullback that would stay above 4,922 and I'd like to buy a clear a clear corrective 3 waves.
So daily, nothing to do if not in from 5,796 with stop below 2,710.
Every week, for one particular cryptocurrency, in addition to the charts that I upload on TradingView, I will put the comments and trade setup for different time frames:
- Daily on Sunday,
- 4h once a day during Asia session and
- 1h twice a day in Asia (post US) and Europe sessions.
This week 22/04/2018-28/04/2018, I propose ZRXBTC
Disclaimer :
This content is provided for educational purposes only. The Trader's Corner is not registered as an investment adviser and the information shared on the website or any other medium is not meant to be a solicitation or recommendation to buy/sell any instrument. Any trades placed based on our content are at the own risk of the viewer. Trading include risks and loss of capital. Future trading results can never be guaranteed.

BNB on the rise again?Can we see Binance token BNBBTC rise again?
It looks to me like a reversed head and shoulders pattern is forming if we can break out the consolidation zone.
i will keep it short , price seems to consolidate after a 25% drop from ATH.
i see a bullish divergence on the rsi.
if we can break resistese i am looking to buy the pullback.
what do you think?

TenX (PAY) Updated Targets (223% Earnings Potential)When the Altcoins market started to retrace and we fully entered the bear market, many of our trades went on hold. I promised that each time a coin received action, I would update my past trade with new targets and relevant information for the present.
Here you have the updated targets for TenX (PAY). You can always visit the old trades if you want more details on this coin.
You can use these targets to sell for profits when the time comes.
TenX Pay Token (PAY) Targets
SHORT TERM
(1) 0.000199
(2) 0.000224
MID TERM
(1) 0.000259
(2) 0.000292
(3) 0.000339
(4) 0.000398
(5) 0.000571
LONG TERM
These targets are based on the all time high back from August 2017. These are really long term targets, TenX Pay will need a huge push in order to challenge these, yet, here you have them for reference and just in case, we all know how GREAT / AWESOME / PROFITABLE & CRAZY the cryptocurrency market can be...
(1) 0.000502
(2) 0.000739
(3) 0.000931
(4) 0.001122
(5) 0.001395
(6) 0.001743 (All time high)
(7) 0.002746 (New all time high)
TenX news
Litecoin and TenX Pay Token: twitter.com
TenX Pay updates on Litecoin & Blockfolio: blog.tenx.tech
Thanks a lot for the likes, share, follow, comments and the incredibly support.
It is always highly appreciated, and I will always be thankful for you... ALWAYS...
And know that... YOU TRULY DESERVE THE BEST!!!
Namaste.


BRD looks ready to begin a new uptrendBRD price action is no longer following downtrend (purple trend lines) and it is starting to perform an iH&S at a supposedly bottom of this trend. Along with that, if the iH&S confirms (neckline breakout above 7k sat), we will likely see as well a golden cross (50MA-orange over 200MA-red) on the 4H chart, and a new uptrend movement.
Fundamentals are good: Ethereum wallet coming next week. ERC20 beta coming in april and waterfall reward system after that
In blue: support/resistances

TenX Pay / USD Macro AnalysisTechnical Analysis:
- PAY/USD seems like a Wyckoff.
- Volume below the 2 big spikes to 5$ would also indicate an Wyckoff Accumulation.
- MACD bands crossing at the daily upwards.
- Volume still missing and still below POC 0.00% and monthly Pivot .
- Target for this rally could be 4.66$ (yearly Pivot ) or maybe we wick through to 6.9$ (100% Fib level).
- New cards (transaction volume ) will also increase the value of PAY Token
Upcoming News:
- Physical cards should come mid May Q2
- Commitment Network Q2
- Maybe Cryptobank in Q2 (depends on their bank license)

XEM/BTC Is the trend line can stop the loss?The day that XEM listed on Binance (Yellow Circle), it jumped from 32000 satoshis to 40000 as we predicted. Per this chart, you can see the support line which XEM reacted to this line several times. We believe this line could hold the price from further loss. It is better to watch it carefully.

Simple Ripple-Another LookHello all,
Down and Dirty!
1) 1.15 or 1.155ish is important because a close above that level is good for all tech analysis and marks bullish run.
2) XRP is trying hard to get there. BTC is breaking to the upside....pretty hard but spillover has not happened yet.
3) If BTC takes a correction that will correlate to XRP and A pullback to the 96-1.06 range.
4) If XRP breaks above 1.15 then expect to move to the higher fib at 1.26. There could be resistance at 1.19 for structure but I would expect a continuation.
5) Earlier in the week, i mentioned a 1.40 target and that is still in play.
6) XRP is forming Higher lows-that is a good sign!
7) Volume is light right now but Its late Friday in the US and Early Sat everywhere else. Especially-All of Asia-Happy New Year!!!
8) The MACD is slowly heading to the upside. A crossover will signal a buy.
WATCH 1.15ish A close above that is bullish!!

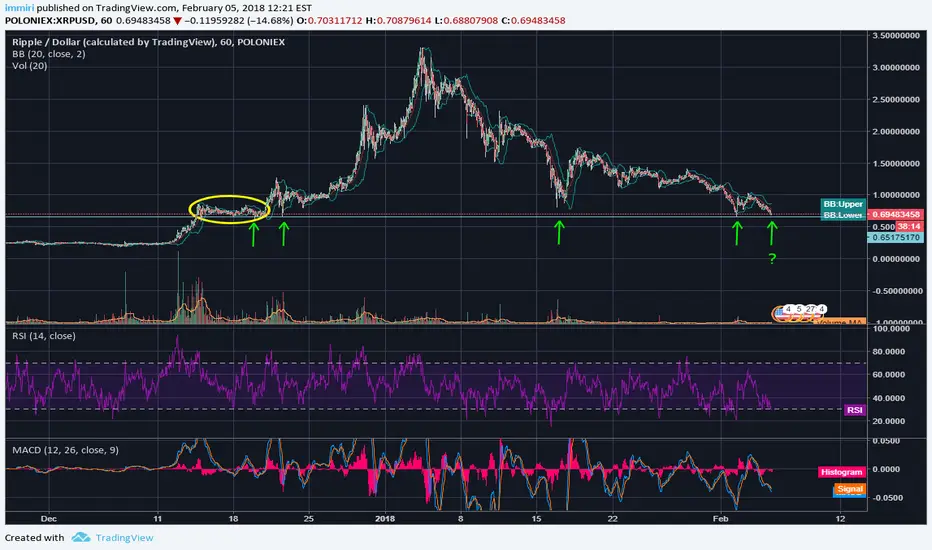
How strong is the $0.68 support line for XRP?As you can see on this chart, the $0.68 is a strong support line for XRP. Several times it dropped but this line support it perfectly. No, it is another time. We should seat and watch what is gonna happen now. If it breaks this support, next one is $0.48 and the 100% correction is $0.24 which should be the last one. I am positive about $0.68.
XRP touching the bottom ? #xrpthestandard #xrp #rippleEven with goods news, new partnerships, good Q4 report, xrp is still very correlated to BTC which is bearish since BTC futures , let's admit it ! Though i believe that we touched the bottom,
unless we get more bad crypto news in Korea.
Robinhood app listing XRP and open trades in february may help the bulls coming back :
techcrunch.com
Coinsquare, the equivalent of coinbase in canada is doing the same in february :
ripplenews.tech
Coincheck refunded his customers after the hack of Millions of XEM tokens. Even if it shows that crypto market's security is still weak, it sends a good signals of trust to future customers.Even if their platform get hacked, they may not lose their tokens :
www.bbc.com
For the hodlers, Here is a video of barlinghouse "a huge central bank may want to use XRP to settle" :
twitter.com
Happy trading !

Simple Token (OST) - trending bullish still, holding supportYou can look at previous charts I posted, but so far we are holding this support line well and it looks like we are about to either go up or stay sideways for a bit. Let me know what else you see or if any comments! I believe that this is the bottom and great spot to get in for long term profit.
For more crypto updates follow me at @BigCryptoCat

Potential for New All-Time High? 0x! (ZRX)Good day traders!
0x is an amazing project and I have a lot of faith in the team. They're producing a decentralized exchange, and many projects are building on it (e.g. Augur, District0x, Status).
After the upward rally yesterday we're slowly reaching the end of the ascending triangle (continuation pattern).
I have conducted 2 scenarios:
Bullish: We break above the resistance soon, like the pattern suggests we would.
Bearish: On the other hand Cryptos are so unpredictable and not all patterns apply. We could also fall down to the $1.5 Support. (Or even further)
--This is NOT financial advice. Please make your own research before investing in any asset--
I wish you successful trades!

Ethereum - Another EraTechnically speaking, based on trends and percentages, this is the road Ethereum will take to 1690. Over/under trading may result in some slight deviation.

LRC Just in middle of the wayPer this chart, LRC is on the wave 2 of 5. The correction to level %38 is completed and it is on the way to complete wave 3 which could be 0.0002 BTC (%100 PROFIT). Keep eyes on this token.

Buying opportunity, if you want a really strong openingOne of the most undervalued coins in the market,
+Great idea
+Great team
+basically competitor for google ad sense
+at the dip
enters: 0.000041 - 0.000042

Massive CUP&HANDLE [BAT] 1 day chartBAT Looking for new highs.
T.A.: MASSIVE CUP&HANDLE, MACD and RSI looks Very Bullish, it could dip a bit before forming the whole handle and take off, this will take a few days, i expect less than one week.
F.A.: It was just added to BITFINEX some days ago
Breakout: 0.000069000
Target: OPEN
