Major Enters Bullish Zone, 800%+ Profits Potential MappedSo this is a game on the TON network. It is good you called this to my attention because I love games. I don't play them but I love them, I think these are good for the Cryptocurrency market.
We are looking at MAJORUSDT, thank you for taking the time to read.
It is my pleasure to write for you and I am always grateful for your continued support... Let's read the chart.
There is high volume on the chart, twice. After 3-February and after mid-March. In both instances the high volume happened on green candles. It is an early reversal signal.
MAJORUSDT was moving down, a downtrend; this is when the candles were producing lower highs and lower lows. 11-March 2025 comes the bottom and the downtrend ends. The end of the downtrend is good news, this market is no longer bearish, it goes from bearish to sideways.
The initial recovery, small, peaks 20-March after 165% growth. Then comes the first retrace and the pair is bullish and strong because it ends in a higher low. 7-April of course, when the entire altcoins market bottomed. This higher low is a technical double-bottom. From this point on, instead of the initial breakout and sideways, we have the start of a bullish wave.
MAJORUSDT starts to grow and now it is up. Current action is happening 153% higher compared to March low, the market bottom.
After some higher highs and higher lows, MAJORUSDT is now sideways again, consolidating but this time bullish, building strength before the next bullish jump. So we can expect some more sideways, with some swings followed by additional growth. You can find two nice targets on the chart.
» The first target sits at $0.9347 for 275% profits potential, the second goes beyond 800%.
I love you.
Thanks a lot.
Your support is appreciated.
Namaste.
TON

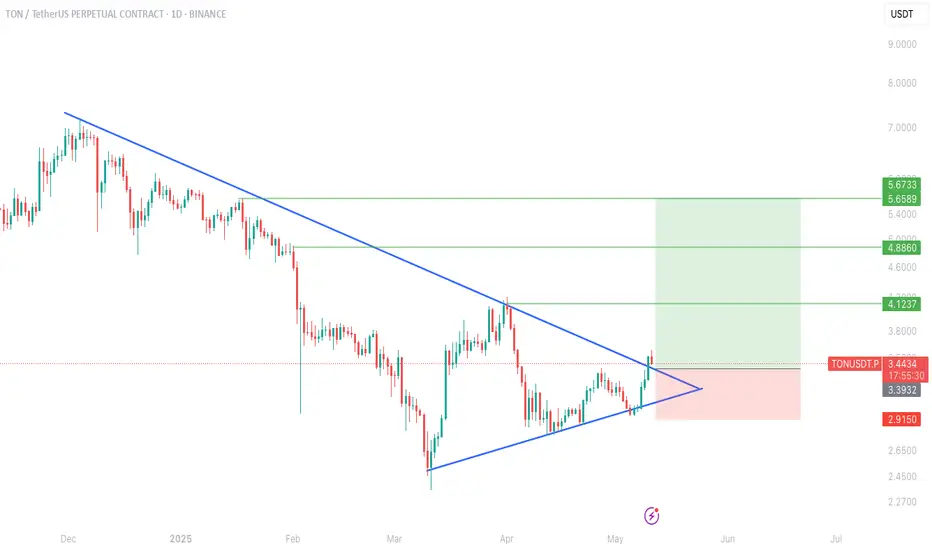
TON AB=CD Analysis !!!Currently, TON is forming an ascending triangle, indicating a potential price increase. It is anticipated that the price could rise, aligning with the projected price movement (AB=CD).
However, it is crucial to wait for the triangle to break before taking any action.
Best regards CobraVanguard.💚

TON/USDT – Ready for the Next Move?🚀 Trade Setup Details:
🕯 #TON/USDT 🔼 Buy | Long 🔼
⌛️ TimeFrame: 1H
--------------------
🛡 Risk Management:
🛡 If Your Account Balance: $1000
🛡 If Your Loss-Limit: 1%
🛡 Then Your Signal Margin: $990.1
--------------------
☄️ En1: 3.082 (Amount: $99)
☄️ En2: 3.073 (Amount: $346.54)
☄️ En3: 3.066 (Amount: $445.55)
☄️ En4: 3.06 (Amount: $99)
--------------------
☄️ If All Entries Are Activated, Then:
☄️ Average.En: 3.074 ($990.1)
--------------------
☑️ TP1: 3.104 (+0.98%) (RR:0.97)
☑️ TP2: 3.12 (+1.5%) (RR:1.49)
☑️ TP3: 3.141 (+2.18%) (RR:2.16)
☑️ TP4: 3.168 (+3.06%) (RR:3.03)
☑️ TP5: 3.198 (+4.03%) (RR:3.99)
☑️ TP6: Open 🔝
--------------------
❌ SL: 3.043 (-1.01%) (-$10)
--------------------
💯 Maximum.Lev: 54X
⌛️ Trading Type: Swing Trading
‼️ Signal Risk: ⚠️ High-Risk! ⚠️
🔎 Technical Analysis Breakdown:
This technical analysis is based on Price Action, Elliott waves, SMC (Smart Money Concepts), and ICT (Inner Circle Trader) concepts. All entry points, Target Points, and Stop Losses are calculated using professional mathematical formulas. As a result, you can have an optimal trade setup based on great risk management.
📊 Sentiment & Market Context:
Toncoin (TON) shows strong bullish momentum against USDT, supported by growing investor confidence and positive market sentiment. After a period of consolidation, the pair is setting up for a potential breakout as technical indicators align with rising demand.
The Toncoin ecosystem, backed by the Telegram Open Network, is gaining traction due to its scalability, speed, and integration potential with Telegram’s massive user base. This real-world utility and adoption fuel bullish sentiment, making TON a top contender in the altcoin space.
⚠️ Disclaimer:
Trading involves significant risk, and past performance does not guarantee future results. This analysis is for informational purposes only and should not be considered financial advice. Always conduct your research and trade responsibly.
💡 Stay Updated:
Like this technical analysis? Follow me for more in-depth insights, technical setups, and market updates. Let's trade smarter together!

TONUSDT 1D AnalysisTON ~ 1D Analysis
#TON Buy back gradually from here with a short term target of at least 15%+, Long term target $8
Be careful with TON !!!Currently, TON is forming an ascending triangle, indicating a potential price increase. It is anticipated that the price could rise, aligning with the projected price movement (AB=CD).
However, it is crucial to wait for the triangle to break before taking any action.
Give me some energy !!
✨We spend hours finding potential opportunities and writing useful ideas, we would be happy if you support us.
Best regards CobraVanguard.💚
_ _ _ _ __ _ _ _ _ _ _ _ _ _ _ _ _ _ _ _ _ _ _ _ _ _ _ _ _ _ _ _
✅Thank you, and for more ideas, hit ❤️Like❤️ and 🌟Follow🌟!
⚠️Things can change...
The markets are always changing and even with all these signals, the market changes tend to be strong and fast!!

$TON Breakout Loading CRYPTO:TONUSD is at the apex of a symmetrical triangle, a breakout is imminent.
A daily close above $3.3095 could trigger a strong move toward $4.2128, $5.6017, and $7.2199 (+120%).
Watch closely. High risk-to-reward setup loading.
DYRO, NFA

#TON/USDT#TON
The price is moving within a descending channel on the 1-hour frame, adhering well to it, and is heading for a strong breakout and retest.
We are experiencing a rebound from the lower boundary of the descending channel, which is support at 3.20.
We are experiencing a downtrend on the RSI indicator, which is about to break and retest, supporting the upward trend.
We are looking for stability above the 100 Moving Average.
Entry price: 3.30
First target: 3.41
Second target: 3.53
Third target: 3.69

TONCOINCRYPTOCAP:TON In the 4-hour timeframe, key support and resistance zones have been identified based on significant highs and lows. The primary resistance area is at $4.070, while the main support level is at $2.860. A descending trendline has been drawn, and the price trading below the 200-period moving average suggests continued bearish momentum in this time horizon. However, if the near-term resistance at $3.590 is broken, a potential upward movement towards the primary resistance at $4.070 could occur. Conversely, a break below the immediate support at $3.000 might lead to a price decrease towards the main support level at $2.860. To confirm bullish or bearish scenarios, monitoring for valid breakouts of these levels along with volume analysis and other technical tools is essential.

Toncoin 5X Lev. Full PREMIUM Trade-Numbers (PP: 1480%)This chart setup with leverage originally came to my attention around 15-April. Seeing the same market conditions now after some consolidation and a small higher low makes the setup stronger.
This is an easy one. I think it has a good chance of success and the timing is about right.
Just make sure your position is safe (low leverage) and you should do fine.
Full trade-numbers below:
_____
LONG TONUSDT
Leverage: 5X
Entry levels:
1) $3.10
2) $2.85
3) $2.65
Targets:
1) $3.23
2) $3.75
3) $4.28
4) $4.62
5) $5.32
6) $6.01
7) $7.01
8) $8.28
9) $9.68
10) $10.5
11) $11.9
Stop-loss:
Close weekly below $2.50
Potential profits: 1480%
Capital allocation: 4%
_____
Leveraged trading can be a lot about position managing and capital allocation, if you are going for those very small and short-term swings. If you are looking for long-term trade setups like I do, timing and entry prices are king. The top priority.
I think both are excellent here but you know anything goes. While I like a high accuracy/hit rate, the market is not without risk and anything can happen at any time. Not all trades are won but it can be good this time.
With the right capital allocation, mindset and planning, you can't go wrong.
As the market turns bullish, as soon as the up-move starts, you have secured an awesome position.
Thanks a lot for your continued support.
Namaste.

#TON/USDT#TON
The price is moving within a descending channel on the 1-hour frame, adhering well to it, and is heading towards a strong breakout and retest.
We are experiencing a rebound from the lower boundary of the descending channel, which is support at 2.97.
We are experiencing a downtrend on the RSI indicator, which is about to break and retest, supporting the upward trend.
We are looking for stability above the 100 Moving Average.
Entry price: 3.02
First target: 3.05
Second target: 3.15
Third target: 3.22

Today's signal is TONHello friends
Given the price growth after reaching resistance, it has entered a correction, which provides a good opportunity to buy in stages and with capital management and move to the specified targets.
*Trade safely with us*

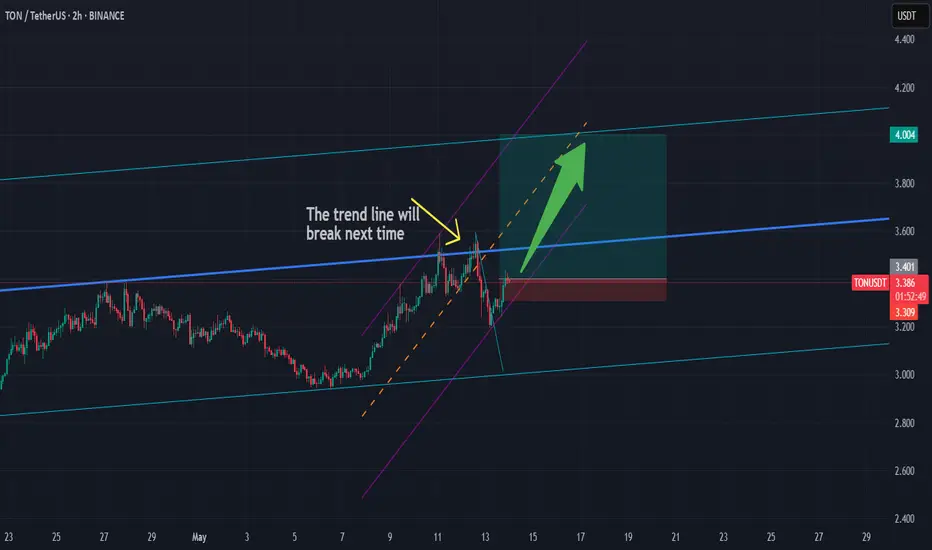
Long TON/USDTThe trend line touch two times and in the next time will break,
We are in the parallel channel and go up,
First target is 4$ soon.
Good Luck..
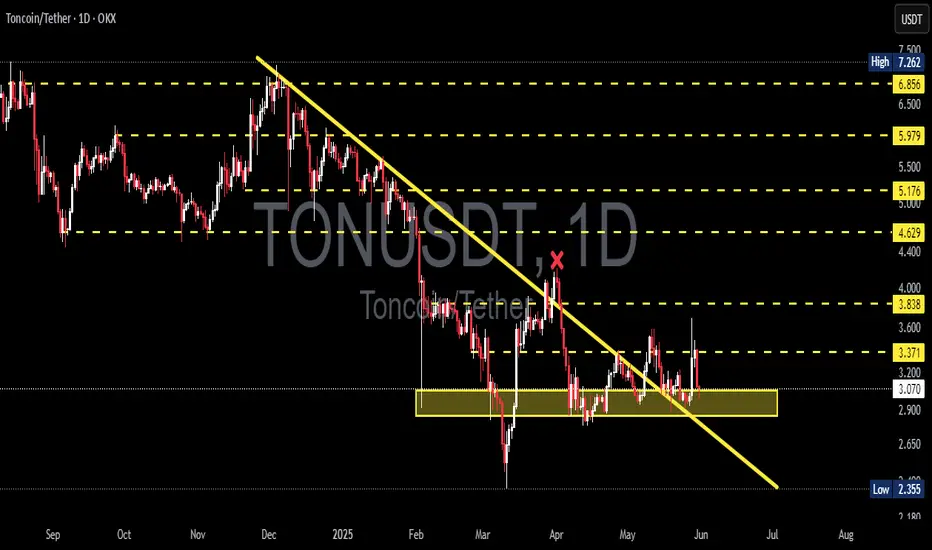
TON breakout alert!!CRYPTOCAP:TON chart Update!
TON has officially broken out of a multi-month symmetrical triangle on the daily chart, signaling a potential trend reversal after a long downtrend.
📈 Clean breakout above descending resistance
🔼 Entry triggered around $3.44
🎯 Targets ahead:
TP1: $4.12
TP2: $4.88
TP3: $5.67
As long as the price stays above the breakout zone, bulls are in control. A successful retest could offer another great entry!
If you find this analysis helpful, please hit the like button to support my content! Share your thoughts in the comments, and feel free to request any specific chart analysis you’d like to see.
Happy Trading!!
TON Bullish📉 TON/USDT 4H Analysis:
After breaking below the key support at 3.729, TON saw a sharp drop toward 2.849, where it found a strong bullish reaction. A short-term bullish correction is currently underway, but resistance at 3.3–3.4 and the 200 EMA may limit further upside. If TON fails to break through, it could retest 2.849 or drop to the 2.505 demand zone. For a true bullish reversal, a confirmed breakout and consolidation above 3.729 is essential.

Toncoin: Still Early But Bullish (PP: 253% & 429%)Believe it or not, it is till early for Toncoin and this is good news for buyers. It is still early but very bullish.
The low here happened 10-March 2025, which means that buyers were present in April and ended up supporting the project and not letting it produce a lower low. This reveals how strong this pair will grow in this bullish cycle.
The current weekly candle is trading above the two previous weeks open and close. This little simple signal reveals that the continuation of the initial bullish reaction when the low was hit is about to happen, or you could, it is the start of the next bullish wave.
The main target I am showing here is $11.95 for a nice 253% profits but there is more. This is the final target only because I am using the linear chart. There is also $17.88 for a great 429%. These targets should hit easily as the bull market develops, expect growth long-term.
It is still early for Toncoin, early but bullish.
Thank you for reading.
Namaste.

TONUSDT Built a Fresh Up Trend!!!Hey Traders, in today's trading session we are monitoring TONUSDT for a buying opportunity around 3.20 zone, TONUSDT is trading in an uptrend and currently is in a correction phase in which it is approaching the trend at 3.20 support and resistance area.
Trade safe, Joe.

TON TON TONHello friends
Due to the entry of buyers and the registration of higher ceilings and floors, we can buy in the direction of the trend and with capital and risk management within the specified ranges and move to the specified targets.
*Trade safely with us*

Wow! Toncoin Amazing Opportunity, The Market...This is what I love about the Cryptocurrency space, it is awesome. The market always gives us tons of time and endless opportunities to make up for any novice mistakes.
Did you miss the bottom, you say? Not true! Just like many other pairs, TONUSDT—Toncoin—is still trading within its long-term buy-zone. This means that there is still time to buy while prices are low trading at support. The best time possible.
Which other market gives such amazing opportunity I just don't know nor care, because we are here now and Cryptocurrency is also here and here to stay.
Traditional traders have to go through coffee and corn looking for a very hard to achieve 1% with a million dollars to be able to make some profits. They have to read bible sized books just to get through the filter that will give them the tricks on how to profit from such unpredictable markets and guess what? When you get the trick, you know it works and it is working, politics gets in the way and messes everything up.
Then the profits potential are so low, that you have to worry about spread, liquidity, fees and even the brokers commission, it makes you into a stingy person; this is not a problem with Crypto.
Profits potential with Cryptocurrency is so high and so easy to spot that you can even allow yourself to make mistakes. When the bullish wave is in, you have so much generosity from the market than rather than worrying about brokers commissions and fees you will be giving hundred dollars tips.
Ok, let's get serious now. It is not like the Cryptocurrency market is paying me to write this.
Let's focus on the chart.
It is the same chart I shared with you for you some week ago. It is the same exact chart but prices are a bit higher that's all.
The classic ABC correction is enough for me to know that a bullish impulse, 1-2-3-4-5, will follow. That's how Elliott Wave Theory works. After a correction, an impulse, after an impulse a correction, back and forth.
So you only need to be able to spot a correction and you know what will happen next.
I know the correction is over based on my observational experience so, prepare for massive growth. It is still early for this pair.
You will notice this phenomena. Some pairs will be more advanced and you think you missed the train, but right "next door" you find another pair that is still trading low. If a pair is already moving, just let it go, always focusing on buying low near support.
The moment you decide to buy the high one because it is growing and will continue to grow, that's when the correction out of nowhere comes. If you buy near support, your risk stays low. If you buy on an impulse and without a plan whatever is moving, this impulse is the clear proof that the action you just made will not produce positive results.
Step back, watch and follow.
I am the Master of the charts.
Namaste.

#TON/USDT#TON
The price is moving within a descending channel on the 1-hour frame and is expected to continue lower.
We have a trend to stabilize below the 100 moving average once again.
We have a downtrend on the RSI indicator, supporting the upward move with a breakout.
We have a resistance area at the upper limit of the channel at 3.73.
Entry price: 3.69
First target: 3.60
Second target: 3.515
Third target: 3.40

WELCOME TO THE BEGINNING OF ALT COIN SEASON!Traders, Hodlr's and Soon to be Liquidity (late retail buyers),
This is likely the moment we have been waiting for. Last week in our weekly VIP market update we discussed just a few things that would really show us if we just saw the bottom of the alts and if it was now time to start seeing some new local HH's and then HL's showing us a shift in trend. I had posted a few trades pointing this out. We have now at this point accomplished what we were looking for to see if we would be starting Alt coins season.
We have been watching a few things. The first being Bitcoin Dominance or CRYPTOCAP:BTC.D as this is a great chart to watch and look for reversals prior to looking at the chart of the specific alt coin against BTC to see if it also is showing it could have a rally or a pullback based on your bias on this BTC.D chart. For instance if I were to want to see maybe when XRP would likely start breaking out say that this BTC.D chart is in fact correct and the triangle trend line will end up being the top for btc dominance at around 64.4% of the total market I would go to BITSTAMP:XRPBTC to give myself some insight on confluence of market movements.
Being that we are now here at the point that I believe we will start to see money flow into alts based on this chart and others such as CRYPTOCAP:TOTAL2 , CRYPTOCAP:TOTAL3 and CRYPTOCAP:TOTALDEFI and the specific BTC pairings that I am holding by looking up the ticker of my alt coin/BTC and studying that chart I will honestly say that I am in the 90%/10% bullish on alts to bearish.
I hope this information helped you in your journey to get more information and come up with your own analysis to base your investment decisions and you become prosperous for doing soo!
Stay Profitable Folks,
Savvy!

$MEMEFI Gearing For A 2,000% Surge Amidst Growing MomentumThe price of $MEMEFI token is set to breakout with over 2000% gains in sight amidst 100% surge and growing momentum.
Initially lunched on the TON blockchain, then later migrated to the Ethereum and finally SUI ecosystem, $MEMEFI has delivered a stunning 230% gains for the past 3 days and setting the coast for a 2,000% surge amidst growing interests on the SUI blockchain.
Since listing, $MEMEFI has seen a 505% surge before undergoing a massive plunge losing 97% of market value. But with present market conditions, $MEMEFI is looking forward to a bullish breakout amid a falling wedge pattern recorded on the daily price chart.
About MemeFi
MemeFi has emerged as a pioneer in the Telegram mini-app space, evolving from a simple idle tap-to-earn game into a sophisticated ecosystem with interconnected gaming mechanics. With over 55 million users and 10 million on-chain wallets, MemeFi has established itself as a leader in bridging the Telegram ecosystem with blockchain technology.
MemeFi Price Data
The MemeFi price today is $0.002678 USD with a 24-hour trading volume of $129,760,593 USD. MemeFi is up 99.35% in the last 24 hours. The current CoinMarketCap ranking is #702, with a market cap of $26,780,147 USD. It has a circulating supply of 10,000,000,000 MEMEFI coins and a max. supply of 10,000,000,000 MEMEFI coins.

TradeCityPro | TON: Eyeing Breakout in Telegram’s Hottest Token👋 Welcome to TradeCity Pro!
In this analysis, I want to review the TON coin for you. This coin is for the Telegram social network, and in 2024, due to airdrops like Notcoin and Hamster that trended, it became very hyped and widely talked about, and the TON blockchain experienced significant growth.
🔍 Currently, the NFT market has also launched on this network, which has prevented this coin from dropping. This coin, with a market cap of $7.78 billion, is ranked 18th on CoinMarketCap.
⏳ 4-Hour Timeframe
In the 4-hour timeframe, as you can see, after the downtrend that the price had, there was a bullish move following the news of Pavel Durov going to Dubai and leaving France, and now the price is in a correction phase again.
⚡️ Currently, a 4-hour range box has formed, with the bottom of this box at the 2.851 zone and the top at 3.216. There's also a mid-line within this box at 3.044, which the price has broken and is moving toward the 3.216 ceiling.
✔️ If the price movement continues toward the top of the box with this momentum and high buying volume, the likelihood of breaking the 3.216 area will increase significantly. So I suggest that with the breakout of this level, you try to have a long position open.
📉 For a short position, if the price gets rejected from the top of the box, you can enter a trade with a trigger on a lower timeframe. Otherwise, the first trigger is the break of 3.044, and the second trigger is the break of 2.851.
🔼 For a long position, the RSI oscillator is near the Overbought area, and if it enters Overbought, we can expect a sharp bullish move.
📊 Market volume is currently in favor of buyers and is increasing. If volume increases and RSI enters Overbought, you can place a stop buy order above the 3.216 level so that if there is a sharp breakout of this level, your position gets triggered as well.
📝 Final Thoughts
This analysis reflects our opinions and is not financial advice.
Share your thoughts in the comments, and don’t forget to share this analysis with your friends! ❤️

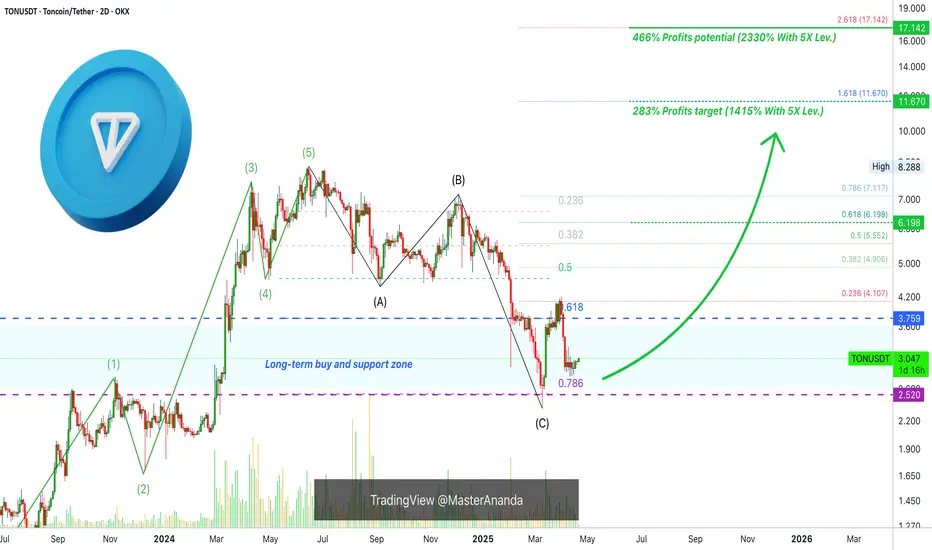
Toncoin Buy-Zone, 466% Rise Starts Now (2330% With 5X Lev.)Truly, opportunities like this do not present themselves very often. Toncoin is now trading within a long-term buy-zone with a higher low bullish signal confirmed.
This signal is confirmed based on multiple TA factors, want to look at those?
— There is a perfect ABC correction pattern.
— There is strong buying at the correction C wave low.
— The same level were support was found was also resistance back in December 2022, Jan., Feb., & March 2023, as well as October and November 2023. A classic strong, long-term resistance level turned support.
— Marketwide action is pointing up.
— The fact that Notcoin is bullish and rising, a related Cryptocurrency, lends additional support to the bullish bias on this pair.
This is not all, a new bullish impulse is also predicted based on the very advanced system of Elliott Wave Theory, the Wave Principle.
» Toncoin (TONUSDT) Trading Strategy
Easy yet strong and high potential for profits target can be seen on the chart for your convenience, the strategy is very simple; leverage or spot, you simply buy and hold, the market will take care of the rest. Once the action goes green and resistance is met, that's the time to take profits and move on to the next trade. You can always comeback when there is a retrace. The market moves in waves.
Prices will grow, yes, but then they will move lower in search for support. Once this drop happens, that's the time to enter again for another LONG. Just as it is now, there was bullish growth followed by a correction, when the correction hits bottom, we go LONG. When the market peaks, we go SHORT (sell—take profits).
Thanks a lot for your continued support.
The correction is over, it is the best time possible to buy and hold.
Focus on the long-term. The market offers endless opportunities. The only way to lose is if you give up. If you made a mistake, just try again. Cryptocurrency is here to stay.
Namaste.