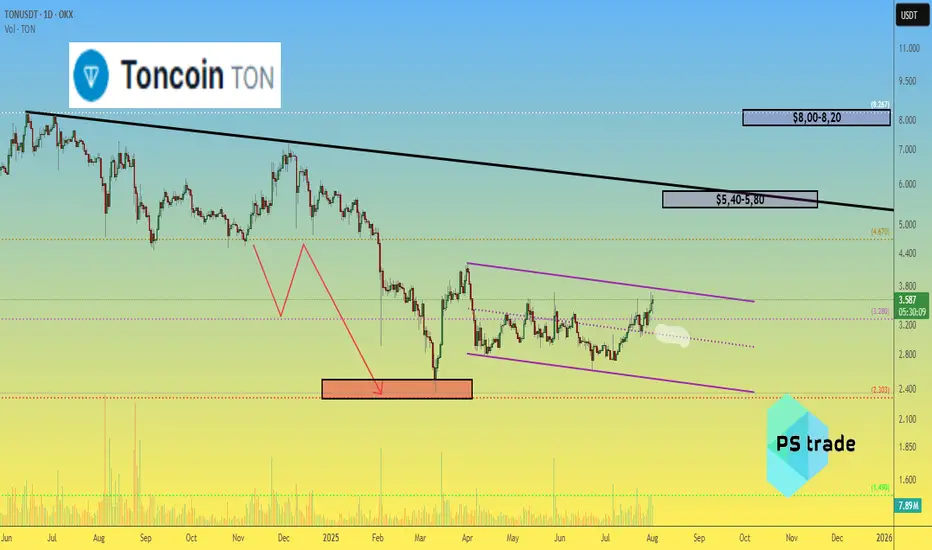
Toncoin TON price analysis💎 CRYPTOCAP:TON didn’t become a legend over the past 9 months — but at least our correction target of $2.30–2.50 played out with precision.
While most of the crypto market is currently going through a correction, #Toncoin keeps pushing upward. Still, we remain realistic:
🎯 First target: $5.40–5.80
🎯 Second target: $8.00–8.20
🚀 It’s not a “to the moon” scenario, but a potential 2x–3x from current levels is attractive.
The key support level OKX:TONUSDT remains at $3.00 — as long as it holds, the bullish trend remains valid.
Tonanalysis
TONUSDT Breaks Out of Bearish Grip! Is a Bullish Rally?🔎 1. Key Pattern: Descending Trendline Breakout + Reaccumulation Zone
After months of downward pressure, TONUSDT has successfully broken above a dominant descending trendline that has been acting as resistance since December 2024.
✅ This breakout occurred with a strong bullish candle and aligns perfectly with a significant historical resistance zone (around $3.00–$3.12).
📌 The area also overlaps with the Fibonacci retracement levels (0.5–0.618) — a zone where trend reversals often occur.
This indicates that the move isn't just noise — it might be the start of a mid-term bullish trend.
---
🧱 2. Consolidation Box = Reaccumulation Zone
TONUSDT spent nearly 4 months ranging sideways between $2.80 and $3.20, forming a clear reaccumulation range.
🔁 This kind of price action often precedes a strong breakout, as smart money accumulates before the next leg up.
🟨 This box now acts as a critical demand/support zone for any potential pullbacks.
---
📏 3. Key Levels to Watch (Support & Resistance)
✅ Bullish Targets (Resistance Levels):
🔹 $3.5404 → Immediate resistance
🔹 $4.0492 → Major resistance to break
🔹 $4.6460
🔹 $5.1961
🔹 $5.9429
🔹 $6.9065
🔹 Local High: $7.2311
🔻 Support Levels:
🔸 $3.1248 – $3.0099 → Key Fibonacci support (0.5–0.618)
🔸 $2.8000 → Bottom of reaccumulation range
🔸 $2.3290 → Major support (also the cycle low)
---
📈 Bullish Scenario (Primary Bias)
If price holds above the key zone at $3.00–$3.12, we could see:
A move towards $3.54 USDT
Breakout above $3.54 opens the door to $4.05 → $4.64 → $5.19 and beyond
A clear structure of higher highs and higher lows confirms trend reversal
Momentum remains strong as long as price respects the breakout zone.
---
📉 Bearish Scenario (Alternative Case to Watch)
If price fails to hold above $3.00 and breaks back below $2.80:
This would suggest a false breakout
Momentum may shift bearish again
Price could revisit the $2.32 support, negating the bullish setup
A return to sideways or even downtrend structure is possible
---
🧩 Strategic Conclusion
TONUSDT has broken out of a key descending trendline and reclaimed a strong structural zone, indicating early signs of a bullish cycle.
📊 Key Levels to Monitor Closely:
Support (validation zone): $3.00–$3.12
Immediate resistance: $3.54
Mid-term targets: $4.05 → $5.19 and higher
> As long as TON stays above the golden zone (Fibonacci 0.5–0.618), bulls have the upper hand.
---
📘 Pro Tips for Traders:
Watch for volume confirmation during retests
Be patient for pullback entries or breakout confirmations
Manage risk — don’t FOMO blindly
#TONUSDT #TONCOIN #CryptoBreakout #AltcoinAnalysis #TechnicalAnalysis #CryptoTrading #TON #Reaccumulation #BreakoutSetup #FibonacciSupport #BullishReversal #TONBullish

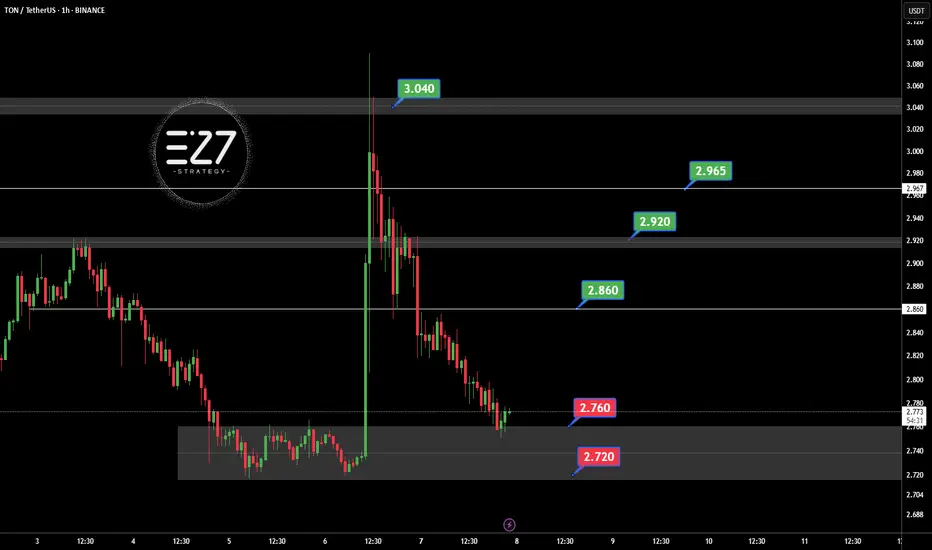
TONUSDT Following the official denial by UAE authorities regarding the possibility of obtaining a golden visa through staking OKX:TONUSDT , the bullish momentum driven by that rumor has faded. Selling pressure has increased, and TON is now consolidating within the key support zone of 2.720 to 2.760 USDT. If this support breaks, further downside is likely. However, if the price holds and reclaims the 2.860 USDT resistance, it could trigger a recovery toward 2.920 and 2.965 USDT. For now, the market sentiment remains bearish with a corrective bias.
Key Points:
UAE officially denied TON-based golden visa claims, weakening sentiment.
Current support zone: 2.720–2.760 USDT.
Key resistance: 2.860 USDT, then 2.920 USDT.
Break below 2.720 = further decline.
Break above 2.860 = potential bullish reversal.
⚠️ Please Control Risk Management in trades.
Today's signal is TONHello friends
Given the price growth after reaching resistance, it has entered a correction, which provides a good opportunity to buy in stages and with capital management and move to the specified targets.
*Trade safely with us*

TON to $3.34? This Chart Pattern Could Deliver 12.88% GainsTON/USDT is currently showing promising signs of bullish momentum on the 4-hour chart. The most compelling reason to lean bullish is the consistent price behavior around the Key Support Zone near $2.899. Over several sessions, the price has tested this zone multiple times without any convincing breakdown. Each test resulted in a strong upward rebound, reinforcing the level’s significance. This repeated validation of support suggests that buyers are stepping in with confidence whenever the price revisits this area.
Looking at recent market structure, the price action is consolidating just above the key support level. Such sideways behavior above a major support zone often hints at accumulation. This means market participants could be preparing for an upward move, especially as there’s no sign of aggressive selling pressure. The market is essentially respecting this base, which strengthens the bullish case.
Above the current price, two resistance levels stand out. The first is around $3.240, which marks the mid-range from a previous consolidation and has acted as resistance in the past. If TON can push above this level, it would likely attract further bullish momentum. The second target is at $3.340, which is the most recent swing high. This level represents a clear take-profit area for swing traders and would complete a healthy retracement to previous highs.
Momentum indicators also align with the bullish sentiment. The MACD indicator shows a bullish crossover, with the MACD line crossing above the signal line. This crossover is happening near the zero line, which often marks the beginning of a strong directional move. Additionally, the histogram is flipping into green territory, suggesting that buying pressure is beginning to outweigh selling activity.
With this technical backdrop, a clear trade setup is present:
• Entry Level: Around $2.95–$2.96 (current price range above support)
• Stop Loss: $2.880 (just below the key support zone to minimize risk)
• Take Profit 1 (TP1): $3.240 (first resistance level)
• Take Profit 2 (TP2): $3.340 (recent local high)
The structure of this trade offers a risk-to-reward ratio of approximately 4.82, which is highly favorable for both swing traders and short-term bulls. The upside potential (~12.88%) vastly outweighs the downside risk (~2.67%). This type of asymmetry in trading setups is what experienced traders often look for — strong support, clear resistances, and momentum indicators confirming the direction.
Traders should also keep an eye on price behavior near $3.240. If the price struggles there, partial profit booking may be wise. On the other hand, a strong breakout above this zone could push TON swiftly toward the $3.340 mark. Volume will be a key factor to monitor — increasing volume on green candles would confirm institutional interest or broader market support behind the move.
In conclusion, the current chart setup on TON/USDT reflects a textbook bullish rebound scenario. With support holding firm, momentum building, and clean upside targets, this presents an attractive opportunity for a long position — especially for traders who favor structured and well-risked entries. The next 8–16 hours could be decisive in validating the move, so it’s worth watching this setup closely.

TONUSDT On the @TONUSDT chart, price is currently making a corrective move after reacting to the key support at 2.800. It may rise toward the 3.230 resistance and potentially break higher with a pullback to continue upward. However, if the 2.800 support fails, a deeper drop could follow. ⚠️📉
Resistances:
• 3.230 💥
• 3.371 🔼
• 3.656 🔼
• 3.948 🚀
Supports:
• 2.910 🛡️
• 2.800 🔻
⚠️Contorl Risk management for trades.

LIVE TRADEHello friends
Given the ascending channel that has formed, we can open positions with capital and risk management to move towards the specified goals.
*Trade safely with us*

$TON Breakout Loading CRYPTO:TONUSD is at the apex of a symmetrical triangle, a breakout is imminent.
A daily close above $3.3095 could trigger a strong move toward $4.2128, $5.6017, and $7.2199 (+120%).
Watch closely. High risk-to-reward setup loading.
DYRO, NFA

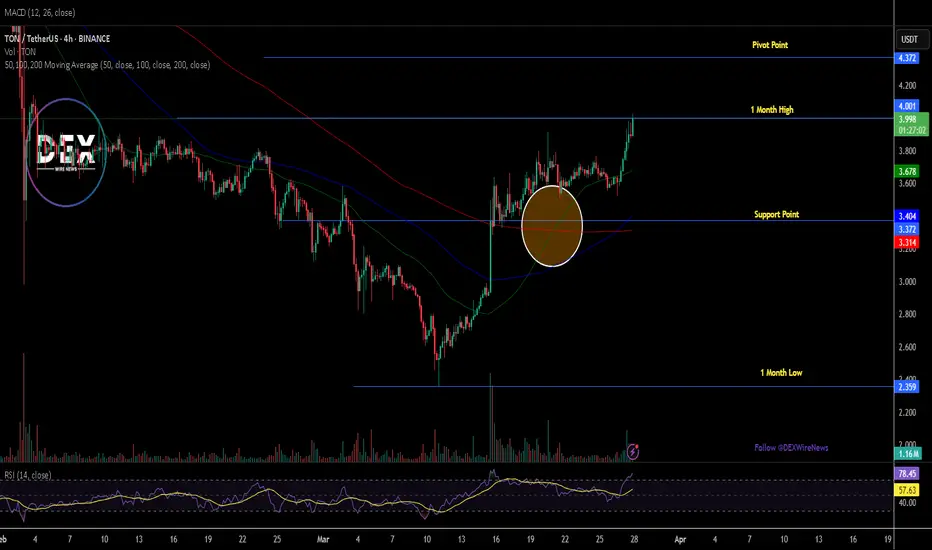
TONCOINCRYPTOCAP:TON In the 4-hour timeframe, key support and resistance zones have been identified based on significant highs and lows. The primary resistance area is at $4.070, while the main support level is at $2.860. A descending trendline has been drawn, and the price trading below the 200-period moving average suggests continued bearish momentum in this time horizon. However, if the near-term resistance at $3.590 is broken, a potential upward movement towards the primary resistance at $4.070 could occur. Conversely, a break below the immediate support at $3.000 might lead to a price decrease towards the main support level at $2.860. To confirm bullish or bearish scenarios, monitoring for valid breakouts of these levels along with volume analysis and other technical tools is essential.

#TON/USDT#TON
The price is moving within a descending channel on the 1-hour frame, adhering well to it, and is heading towards a strong breakout and retest.
We are experiencing a rebound from the lower boundary of the descending channel, which is support at 2.97.
We are experiencing a downtrend on the RSI indicator, which is about to break and retest, supporting the upward trend.
We are looking for stability above the 100 Moving Average.
Entry price: 3.02
First target: 3.05
Second target: 3.15
Third target: 3.22

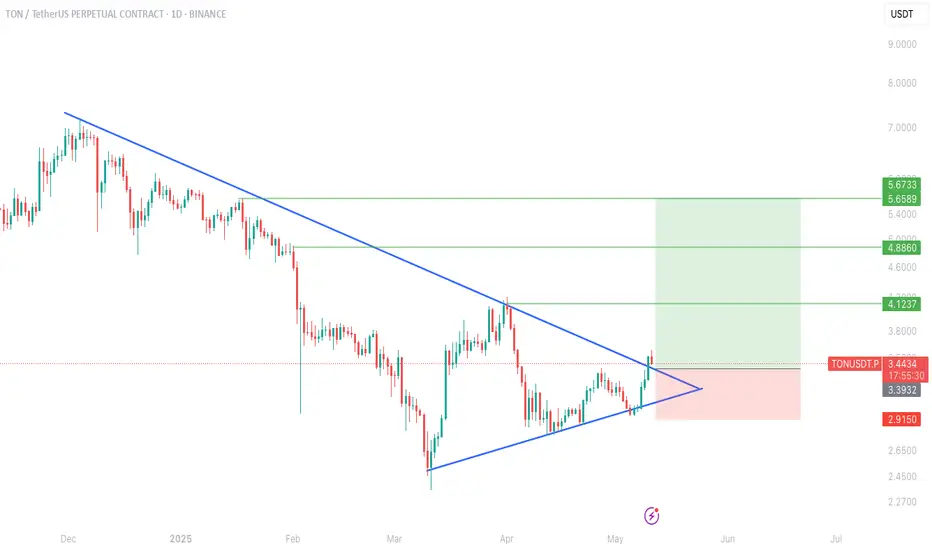
TON breakout alert!!CRYPTOCAP:TON chart Update!
TON has officially broken out of a multi-month symmetrical triangle on the daily chart, signaling a potential trend reversal after a long downtrend.
📈 Clean breakout above descending resistance
🔼 Entry triggered around $3.44
🎯 Targets ahead:
TP1: $4.12
TP2: $4.88
TP3: $5.67
As long as the price stays above the breakout zone, bulls are in control. A successful retest could offer another great entry!
If you find this analysis helpful, please hit the like button to support my content! Share your thoughts in the comments, and feel free to request any specific chart analysis you’d like to see.
Happy Trading!!
TON Bullish📉 TON/USDT 4H Analysis:
After breaking below the key support at 3.729, TON saw a sharp drop toward 2.849, where it found a strong bullish reaction. A short-term bullish correction is currently underway, but resistance at 3.3–3.4 and the 200 EMA may limit further upside. If TON fails to break through, it could retest 2.849 or drop to the 2.505 demand zone. For a true bullish reversal, a confirmed breakout and consolidation above 3.729 is essential.

Toncoin: Still Early But Bullish (PP: 253% & 429%)Believe it or not, it is till early for Toncoin and this is good news for buyers. It is still early but very bullish.
The low here happened 10-March 2025, which means that buyers were present in April and ended up supporting the project and not letting it produce a lower low. This reveals how strong this pair will grow in this bullish cycle.
The current weekly candle is trading above the two previous weeks open and close. This little simple signal reveals that the continuation of the initial bullish reaction when the low was hit is about to happen, or you could, it is the start of the next bullish wave.
The main target I am showing here is $11.95 for a nice 253% profits but there is more. This is the final target only because I am using the linear chart. There is also $17.88 for a great 429%. These targets should hit easily as the bull market develops, expect growth long-term.
It is still early for Toncoin, early but bullish.
Thank you for reading.
Namaste.

Is a TON Pump Coming?Is a TON Pump Coming? 🚀
TON, the blockchain developed by Telegram’s team, has gained significant attention due to its low transaction fees and strong connection with Telegram. Recent increases in liquidity and demand indicate growing investor interest in this cryptocurrency.
🔹 Technical Analysis:
TON is currently in a short-term uptrend, with $4 acting as a key resistance level. A confirmed breakout above this level could push the price towards $7. However, failure to break this resistance may lead to a price correction toward lower support levels.
🔹 Potential Risks:
A significant portion of TON tokens is held by whales, which could lead to high volatility. Additionally, its unlimited supply poses long-term inflation risks if not managed properly.
🔹 Growth Catalysts:
Recent positive news, such as Telegram’s potential partnership with AI (Grok) and the release of key updates, could drive further demand. If TON sustains its momentum and breaks key resistance levels, it may enter a stronger bullish phase.
📌 Conclusion:
While TON has strong fundamentals and market interest, its long-term stability depends on supply management and investor behavior. Entry at key levels with proper risk management is essential for those looking to trade or invest. 🚀

TON Claims $4 Pivot Amidst A Golden Cross PatternThe price of CRYPTOCAP:TON spiked 9% today reclaiming the $4 price pivot with further growth set to occur amidst a "Golden Cross" pattern.
The Open Network ( CRYPTOCAP:TON ) is a revolutionary blockchain platform designed to handle millions of transactions per second. It uses a unique multi-blockchain architecture with dynamic sharding and instant messaging between chains.
The system aims to make blockchain technology accessible to everyday users through integration with messaging apps and user-friendly services. TON has become one of the fastest-growing blockchain ecosystems, with numerous decentralized applications and services being built on its infrastructure.
As of the time of writing, CRYPTOCAP:TON is up 9% trading within overbought regions as hinted by the RSI at 78.78 with growing momentum and the appearance of a golden cross pattern, a breakout to $6 is feasible.
For TON, a breakout above the 1-month high pivot could cement a move to the $6 region. Similarly, in the case of a cool-off, given the RSI is overbought, the 38.2% Fibonacci level is acting as support for $TON.
Toncoin Price Live Data
The live Toncoin price today is $3.96 USD with a 24-hour trading volume of $285,169,930 USD. Toncoin is up 8.27% in the last 24 hours. The current CoinMarketCap ranking is #12, with a live market cap of $9,833,721,005 USD. It has a circulating supply of 2,484,304,181 TON coins and the max. supply is not available.
TONCOIN BUY !!!hello friends
Considering the heavy fall that we had, the price was able to maintain itself and with the specified support, we are going for the specified goals, of course, with risk and capital management...
*Trade safely with us*

Toncoin TON price will surprise everyone💎If you look closely at the OKX:TONUSDT chart, you can see/think that the last six months have seen a global trend reversal pattern - Head and Shoulders.
But! This pattern will be confirmed after the price of CRYPTOCAP:TON is firmly fixed below $4.50. Then the target is $2.30-2.50.
However, this is all very obvious, trite, and not interesting)
We want this idea to become prophetic and Legendary, so we hope for the beginning of a hypercycle of #Toncoin price growth with an ultimate goal of $93
_____________________
Did you like our analysis? Leave a comment, like, and follow to get more

TONUSDT TONUSDT Signal 🚀
🔹 Entry: Wait for a complete pullback (Confirm support) 3.154
🔹 Targets:
🎯 3.489 (First resistance)
🎯 3.869 (Key breakout level)
🎯 4.478 (Major resistance)
🎯 4.731 (Final target)
🔹 Stop Loss: 2.731 (Below key support)
🔹 Risk Management: Control your risk before entering

TON at a very bottomAfter the rejection from the descending triangle we had, now $3 is going to be the last/strong support and I'm expecting another push to about $19 in next few weeks or months

TONUSDT ANALYSISHere's my view and understanding of TONUSDT.
It's following the Trendlines drawn perfectly until now.
If breaks the Resisting Trendline, One can consider adding quantities at retest.
Or else Wait.

35% TON PumpSignal:
📥 Entry Point: Between 4.950 and 5.180
🔴 Stop Loss: 4.650
📈 Targets:
5.642
6.006
6.342
6.750
Overall Trend Analysis:
📉 Current Trend: Bearish with a potential reversal from the buy zone.
🟡 Moving Average (MA): Price is below the MA, indicating selling pressure continues.
📊 Note: If the price stabilizes in the buy zone, there’s a high probability of reaching the mentioned targets.
⚠️ Warning: If the stop loss is breached, the bearish trend may strengthen, invalidating the setup.

TON, sellers are showing their weakness, it's a good time to buyTON, sellers are showing their weakness, it's a good time to buy
Three times sellers tried to sell the price lower, and the movement each time became smaller, the last movement with no volume showed the complete powerlessness of sellers, and gives a good entry point to buy. I'm going in with a potential of 1:4
🚀 Trade with the professionals of THS - Wave Theory!
🔹 All trades are based on wave analysis.
🔹 Fixed stop loss and take profit for risk management.
🔹 100% automation: copy trades through CopyFX service.
🔹 Reliability and transparency: the results are confirmed by the market.
📈 Don't miss the chance to earn steadily!
👉 Connect to CopyFX with THS and start copying profitable trades right now!
💡 Details on our channel and in the app!

TONUSDT | Good Area to FollowI think blue box will support the price.
I don't overcomplicate things and add a ton of dirty crap to my charts, but you can check out the success of my analysis below.
I approach trading with confidence backed by experience and past success in identifying high-probability setups.
While I don’t claim to be the best, my track record speaks for itself, and I strive to let my analysis and results do the talking. Watch these levels closely—markets can confirm what charts already whisper. Let’s see how this plays out together.
My Previous Ideas
DOGEUSDT.P | 4 Reward for 1 Risk much more if you hold it.
RENDERUSDT.P | HTF Accuracy
ETHUSDT.P | Accurate Buyer Zone Identification | High Risk Reward if you hold it.
BNBUSDT.P | Accurate Buyer Zone Identification | High Risk Reward if you hold it.
Bitcoin Dominance | Great Characteristic Detection and Accurate Analysis
