TONUSDT Breaks Out of Bearish Grip! Is a Bullish Rally?🔎 1. Key Pattern: Descending Trendline Breakout + Reaccumulation Zone
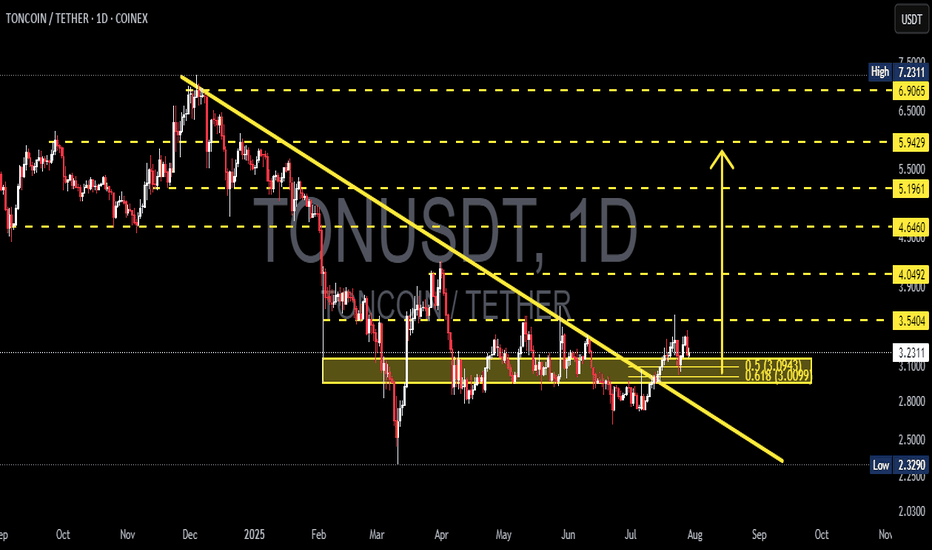
After months of downward pressure, TONUSDT has successfully broken above a dominant descending trendline that has been acting as resistance since December 2024.
✅ This breakout occurred with a strong bullish candle and aligns perfectly with a significant historical resistance zone (around $3.00–$3.12).
📌 The area also overlaps with the Fibonacci retracement levels (0.5–0.618) — a zone where trend reversals often occur.
This indicates that the move isn't just noise — it might be the start of a mid-term bullish trend.
---
🧱 2. Consolidation Box = Reaccumulation Zone
TONUSDT spent nearly 4 months ranging sideways between $2.80 and $3.20, forming a clear reaccumulation range.
🔁 This kind of price action often precedes a strong breakout, as smart money accumulates before the next leg up.
🟨 This box now acts as a critical demand/support zone for any potential pullbacks.
---
📏 3. Key Levels to Watch (Support & Resistance)
✅ Bullish Targets (Resistance Levels):
🔹 $3.5404 → Immediate resistance
🔹 $4.0492 → Major resistance to break
🔹 $4.6460
🔹 $5.1961
🔹 $5.9429
🔹 $6.9065
🔹 Local High: $7.2311
🔻 Support Levels:
🔸 $3.1248 – $3.0099 → Key Fibonacci support (0.5–0.618)
🔸 $2.8000 → Bottom of reaccumulation range
🔸 $2.3290 → Major support (also the cycle low)
---
📈 Bullish Scenario (Primary Bias)
If price holds above the key zone at $3.00–$3.12, we could see:
A move towards $3.54 USDT
Breakout above $3.54 opens the door to $4.05 → $4.64 → $5.19 and beyond
A clear structure of higher highs and higher lows confirms trend reversal
Momentum remains strong as long as price respects the breakout zone.
---
📉 Bearish Scenario (Alternative Case to Watch)
If price fails to hold above $3.00 and breaks back below $2.80:
This would suggest a false breakout
Momentum may shift bearish again
Price could revisit the $2.32 support, negating the bullish setup
A return to sideways or even downtrend structure is possible
---
🧩 Strategic Conclusion
TONUSDT has broken out of a key descending trendline and reclaimed a strong structural zone, indicating early signs of a bullish cycle.
📊 Key Levels to Monitor Closely:
Support (validation zone): $3.00–$3.12
Immediate resistance: $3.54
Mid-term targets: $4.05 → $5.19 and higher
> As long as TON stays above the golden zone (Fibonacci 0.5–0.618), bulls have the upper hand.
---
📘 Pro Tips for Traders:
Watch for volume confirmation during retests
Be patient for pullback entries or breakout confirmations
Manage risk — don’t FOMO blindly
#TONUSDT #TONCOIN #CryptoBreakout #AltcoinAnalysis #TechnicalAnalysis #CryptoTrading #TON #Reaccumulation #BreakoutSetup #FibonacciSupport #BullishReversal #TONBullish
Tonusdtanalysis
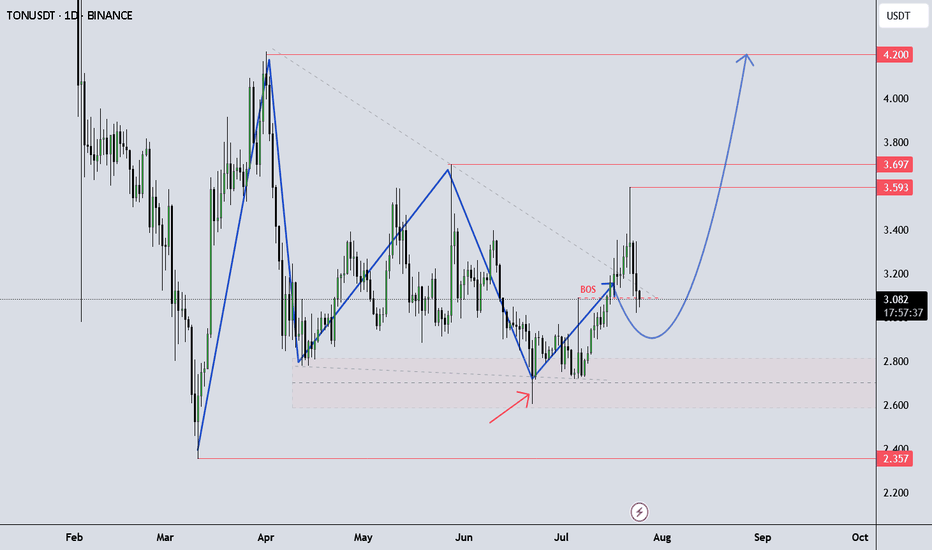
TONUSDT continue up!Looking for an Impulse Up – TONUSDT Outlook
TONUSDT is showing momentum to the upside as it continues its current structure, possibly developing another impulsive leg.
It’s important to follow your own trading plan and maintain proper risk-reward (RR) discipline.
This idea is shared for educational purposes only to support your learning.
Got questions? Feel free to drop them in the comments!
TONUSDT Technical Analysis – Bearish Shift with Clean TargetMarket Context:
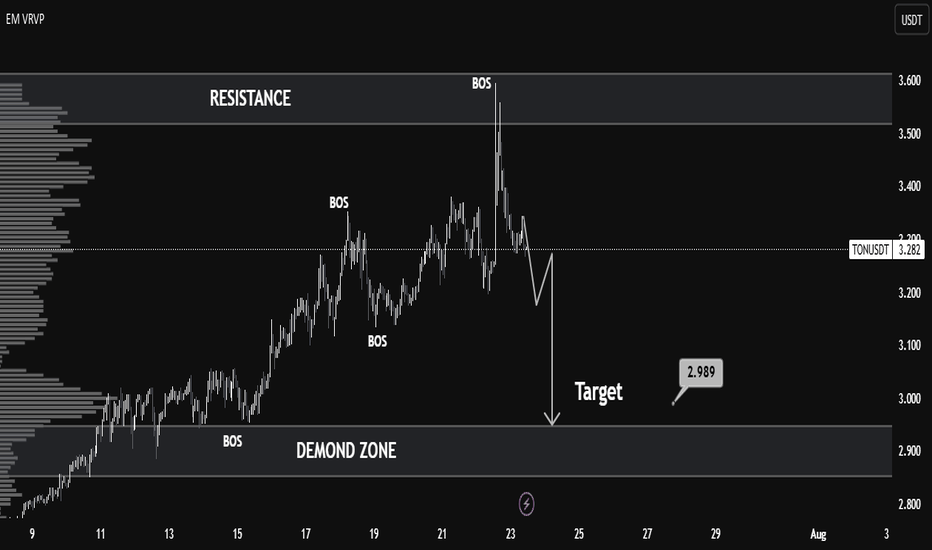
TONUSDT recently showed strong bullish momentum, breaking multiple structure levels (noted as BOS – Break of Structure), indicating a clear uptrend. However, the most recent price action reveals a sharp rejection from the resistance zone around 3.55–3.60, marking a significant trend reversal.
Key Levels:
Resistance: 3.55 – 3.60
Price tested this zone and was strongly rejected, forming a potential top.
Demand Zone: 2.88 – 2.99
This zone provided previous accumulation and serves as a probable liquidity area and downside target.
Target: 2.989
The chart marks this as the near-term bearish objective, aligning with the volume node and prior demand.
Technical Signals:
Multiple BOS (Break of Structure):
Confirmed bullish structure earlier, but the latest BOS downward indicates a possible trend reversal.
Volume Profile (VRVP):
Shows high volume nodes around 3.00, suggesting strong market interest at lower levels — acting as a magnet for price.
Bearish Market Structure:
After the peak, the lower highs and lower lows pattern reflects short-term bearish dominance.
Liquidity Grab & Selloff:
The spike above resistance likely induced liquidity before a rapid selloff — classic distribution behavior.
Outlook:
If the market fails to reclaim levels above 3.35, a bearish continuation toward 2.989 remains likely.
The demand zone (2.88–2.99) is a critical area where buyers may re-enter — look for reversal signals here.
Conclusion:
TONUSDT has shifted from bullish to bearish in the short term. A clean rejection from resistance and strong structural breaks suggest a move toward the 2.989 demand zone. Traders should watch for confirmation of support or continuation upon reaching this level.
TONCOIN Preparing for Liftoff from the Golden Zone! Potential UpDetailed Breakdown:
🔶 Major Support Zone (Golden Accumulation Area):
TON is currently trading within a strong support zone between 2.839 - 2.300, which previously acted as a key resistance throughout 2023. This zone now serves as a high-probability accumulation area.
🔶 Double Bottom Structure & Reversal Potential:
The price action is forming a potential double bottom pattern, often signaling a major reversal after a prolonged downtrend. This is also supported by sideways consolidation on the support with decreasing selling momentum.
🔶 Bullish Targets (Based on Fibonacci & Historical Resistance):
If a bounce occurs from this golden support area, TON could rally towards the following key resistance levels:
🎯 Target 1: 3.247
🎯 Target 2: 4.087
🎯 Target 3: 4.798
🎯 Target 4: 5.879
🎯 Target 5: 6.865
🎯 Target 6: 7.932
🎯 Ultimate Target (ATH): 8.283
🔶 Maximum Potential Upside:
From the current level (around 2.839) to the all-time high (8.283), TON presents a +190% upside opportunity in a full bullish scenario.
Trading Strategy:
✅ Buy Zone: Accumulate within the golden support box (2.3 - 2.8 USDT)
🔁 Additional Entry: Upon breakout confirmation above 3.25 USDT
❌ Stop Loss: Below 2.2 USDT with strong bearish volume
📈 Take Profit Levels: Use resistance levels as partial TP targets
Conclusion:
TONCOIN is positioned at a technically significant support area, offering a high-risk-reward opportunity for swing traders and mid-term investors. A bullish reaction from this zone could initiate a strong multi-wave rally. Watch for breakout confirmation with volume before entering aggressively.
#TON #TONCOIN #CryptoBreakout #AltcoinSetup #TONUSDT #SwingTrade #BullishPattern #CryptoSignals #FibonacciLevels #TechnicalAnalysis
TON Looks Ready to Collapse — Is This the Start of a Bull Trap?Yello Paradisers! what if TON is about to reverse hard—are you positioned correctly, or will you be caught chasing the wrong move?
💎TONUSDT is showing clear bearish signs that can’t be ignored. The price has broken down from an ascending channel—a classic early signal of weakness. But that’s not all. This breakdown happened right at the resistance zone, and it’s backed by a clear bearish divergence on momentum indicators. Adding to the conviction, there’s a 1H Fair Value Gap (FVG) sitting right in that same region, which often acts as a magnet for price before continuation to the downside.
💎This confluence significantly increases the probability of a bearish move in the short term. So, what’s the plan?
💎For risk-averse (safe) traders, the optimal approach is to wait for a pullback and retest of the broken structure. This allows for a cleaner entry and a much better risk-to-reward (RR) ratio. For the aggressive players, there’s potential to enter with reduced size from the current level, understanding that it carries more risk without confirmation.
💎However, if the price manages to break out and closes candle above the resistance zone, this entire bearish setup becomes invalidated. In that case, the smart play is to stay patient and wait for a more favorable structure or price action to develop.
🎖If you want to be consistently profitable, you need to be extremely patient and always wait only for the best, highest probability trading opportunities.
MyCryptoParadise
iFeel the success🌴
#TONUSDT is testing resistance – expecting a breakout!📈 LONG BYBIT:TONUSDT.P from $3.8920
🛡 Stop Loss: $3.8525
⏱️ 1H Timeframe
✅ Overview:
➡️ BYBIT:TONUSDT.P is testing $3.8880 resistance, and a breakout could lead to further upside.
➡️ Price remains above POC $3.81, confirming strong buyer interest.
➡️ Rising volume supports the potential bullish move.
⚡️ Plan:
➡️ Bullish confirmation requires a strong close above $3.8920.
➡️ If price slows down at $3.9400, partial profit-taking is recommended.
➡️ A drop below $3.8525 invalidates the setup.
🎯 Take Profit:
💎 TP1: $3.9400 – first profit-taking zone.
💎 TP2: $3.9800 – final upside target.
📢 BYBIT:TONUSDT.P Holding above $3.8920 opens the door for further gains. Watch volume closely – if it weakens, price may consolidate.
📢 Partial profit-taking recommended at $3.9400.
📢 If price drops below $3.8525, the setup is invalidated
🚀 BYBIT:TONUSDT.P is testing resistance – expecting a breakout!
TONUSDT Primed for Liftoff After Rebounding from Key SupportOKX:TONUSDT has shown impressive resilience with a strong bounce off a major support level. This positive price action is further reinforced by a breakout from a prevailing trendline, accompanied by robust trading volume. These technical indicators suggest a potential for significant upward movement in the near future. While the outlook is bullish, it's crucial to manage risk effectively by implementing appropriate stop-loss orders to protect your investment.
OKX:TONUSDT Currently trading at $6
Buy level: Above $6
Stop loss: Below $5
Target : $12
Max Leverage 3x
Always keep Stop loss
Follow Our Tradingview Account for More Technical Analysis Updates, | Like, Share and Comment Your thoughts
From $6 to $7 or $5? TON Keeps Us Guessing!Toncoin is currently dancing in the range zone where the price action will likely remain slow and choppy.
1. If we see a dip and bounce from $5.89, followed by a climb above the $6.30 mark, it could signal that the bulls are warming up for a rally. A break past the descending trendline might just set the stage for an upward march toward $6.45, with the ultimate prize being $7.23 (Dashed and Solid Green Projections).
2. On the flip side, if $5.89 cracks under pressure, we could be witnessing more bearishness short-term. And if the bears really sink their claws in, a dip toward $5.10 might be on the cards (Red Projection).
For now, the chart is hinting that patience is the name of the game. Keep an eye on those levels, and let the market tip its hand before making any moves. The setup is as straightforward as it gets: adapt and react!
Left Behind No More: TON Prepares to Join the Bull Market SurgeBINANCE:TONUSD has been lagging behind the broader market rally, showing little momentum while other assets have been catching fire in this early bull run. But TON’s underperformance may be setting it up for a parabolic move as it catches up with the rest of the pack. The key now is how it navigates a series of critical resistance levels that could pave the way for a strong breakout.
Chart Analysis
BINANCE:TONUSD faces a major trendline resistance overhead, which has kept its price action constrained. This trendline has acted as a ceiling, pushing TON back down each time it attempted a breakout. But the setup is starting to look primed for a potential breakout, especially if it clears the daily order block (OB) near $5.18.
Entry Levels
Aggressive Entry: For those looking to enter sooner, around $4.89 aligns with the first resistance level and a potential retest of the order block. This level might reject, but for those willing to take the risk, it provides an early entry point.
Safer Entry Level: Waiting for a daily close above $5.18 could offer a stronger entry. This would confirm a break above the daily OB, flipping it into support and creating a solid foundation for TON’s next leg up.
Clearing $5.18 with a solid daily close will signal that TON is ready to reclaim lost ground. From there, the next significant target is around $6.68, followed by an eventual test of $7.42. This range, once reached, could push TON into a more sustained uptrend, as it gains strength from the breaker block above, leading it to catch up with other assets in the bull market.
Target & Potential Path
If CRYPTO:TONUSD TON breaks these resistance levels and confirms the trendline breakout, it could trigger a chain reaction—one that propels it toward $8.36 and beyond. This level represents a long-term target and is the likely zone for profit-taking as TON aligns with the broader market’s bullish momentum.
The setup is there. Now it’s a matter of whether TON can seize the momentum and break out of its slumber.
--------
Follow me for more updates and chart insights! Remember to trade safely, keep risk management at the top of your game, and always trust your own analysis before making moves.
Cheers!
TONUSDT: High Probability SetupsYello Paradisers! 🚨 If TONUSDT corrects lower, we could see a potential bounce from the identified demand zones. But for this to happen, we need confirmation.
💎TONUSDT needs to display a Change of Character (I-CHoCH) on the lower time frames, which would shift the structure to a bullish outlook and strengthen the likelihood of a bounce from this zone.
💎If the price falls below the initial zone, it could drop to our stronger demand area below. Don’t forget that there’s a supportive trendline in this region, which could act as an inducement for price. To validate this setup, look out for bullish patterns like a W pattern, Inverse Head and Shoulders, or signs of bullish divergence—these will make it a higher probability move to the upside.
💎However, if we see a strong candle close below these levels, it would invalidate this setup, and we would need to reassess the scenario. Remember, TON is fundamentally solid, so the focus should be on high-probability long setups. Patience and precision are key here, Paradisers!
Stay strategic and wait for the best opportunities—consistency is what sets the pros apart from the rest.
MyCryptoParadise
iFeel the success🌴


