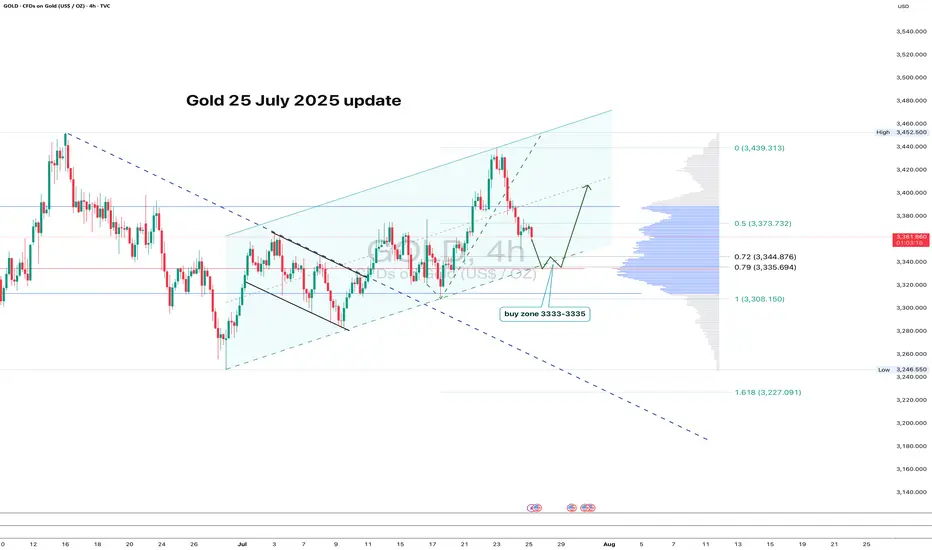
GOLD: clean pullback - now let’s see if support holdsGold continues to trade within an ascending channel on the 4H chart. After a local high, the price pulled back and is now approaching the key zone at 3333–3335. This area lines up with the 0.79 Fib retracement, the lower channel boundary, and a major volume cluster — a classic confluence zone.
If buyers show up here and we get a bullish reversal candle, this becomes a valid long setup with a tight stop just below the level. First target is 3373 (0.5 Fib), followed by a potential retest of the high near 3439.
The structure remains intact, the pullback is orderly, and volume supports the move. As long as the channel holds - the bias stays bullish.
Toptrader
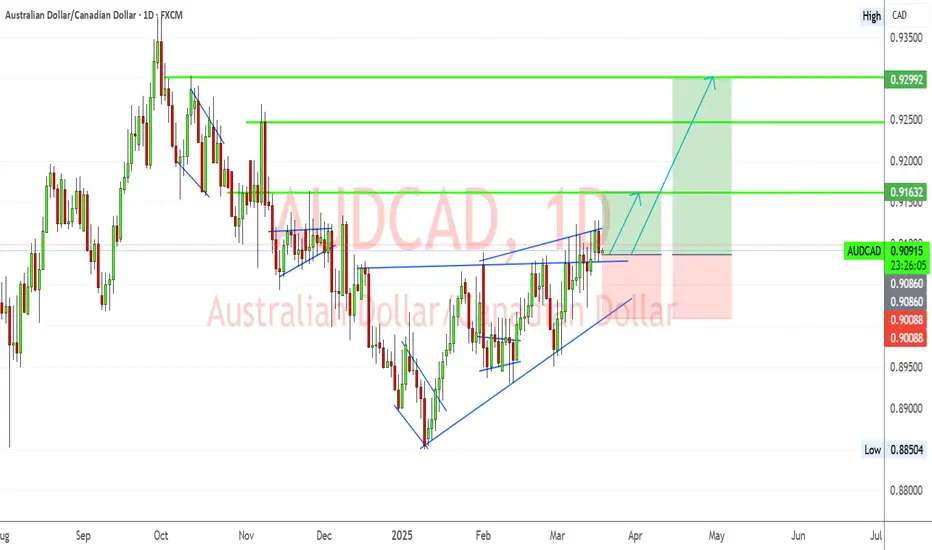
AUD/CAD Breakout in Motion – Bulls Targeting Higher LevelsTechnical Overview:
The AUD/CAD pair has formed a clear ascending triangle pattern, signaling bullish momentum.
A successful breakout above the resistance zone indicates potential upward movement toward key levels.
Price is currently testing a resistance level near 0.9093, and a clean break above could trigger a strong rally.
Key Levels to Watch:
Entry Zone: Above 0.9093 (breakout confirmation)
First Target (TP1): 0.9163
Second Target (TP2): 0.9299
Stop Loss (SL): Below 0.9008 (previous structure support)
Supporting Factors for Bullish Bias:
✅ Trendline Support: The ascending trendline is holding strong, reinforcing bullish structure.
✅ Higher Lows Formation: Indicates buyers are stepping in aggressively.
✅ Breakout Confirmation: If price sustains above 0.9093, momentum will likely continue.
BTC price still lacks “bonafide breakout”Whether this develops into a bull trap or a bonafide breakout remains to be seen. Keeping an eye on liquidity dynamics around $100k and Purple Whale order flow.
Crypto and risk assets meanwhile stood to benefit from increasing US dollar weakness.

Holding gold or BTC ?At the time of writing, BTC commands a total market cap of slightly more than $1.9 trillion, while gold’s market cap is almost 10 times greater, around $19 trillion. While there is still a lot of room to grow for BTC, experts opine that it won’t be long before the ‘digital gold’ starts chipping away at gold’s dominance.
In a recent client note, analysts at trading firm Bernstein predicted that BTC is on track to replace gold in as little as 10 years. The note stated that BTC is slated to assume gold’s role as a reliable safe-haven asset.

Why This Sell-Off Could Be the Best Buying Opportunity of 2024DeepSeek's cost advantages are more evolutionary than revolutionary, and cheaper AI compute could actually fuel demand rather than hurt it.
Nvidia's competitive moat isn't just about its hardwareit's the software.

The Last RaveI think the money is piling up to buy but the fundamentals are not looking favorable, on the contrary, the world landscape is changing because Trump is in office, many political and geopolitical conflicts may be coming to an end, and there is reason to believe that this is the last hurrah for Wall Street. Gold prices may be in for a long correction ahead.

Will it be great again?Markets are also looking ahead to Monday's inauguration of President-elect Trump for potential clarity on forthcoming policy changes.
US Stocks Post Strong Gains.
All signs point to a possible break in resistance levels

Oil is now heading for its third consecutive weekly gain.The global oil market is tightening due to reduced supply from key exporters like Russia and Iran, as well as a surge in demand for heating fuels.
Looking at the technical charts, oil prices are very tenacious, as if they are building firmer foundations in preparation for a subsequent breakout to the upside.

Huge Bitcoin Bounce Imminent?The largest crypto slipped to a session low of $91,250 on Thursday, losing about 9% in two days from its Jan. 7 peak above $102,200. BTC has recouped some of its losses and recently traded at $94,390, still down 2.2% over the past seven days.

Traders now expect the Fed to hold rates steadyFor the week, gold is set for its best performance since mid-November last year.
However, the technical setup is still bearish, given resistance at the $2,760/oz level is holding firm.
Higher interest rates reduce its appeal as a non-yielding asset

Would a brokerage recommendation be reliable?Of the 44 recommendations that derive the current ABR, 37 are Strong Buy and three are Buy. Strong Buy and Buy respectively account for 84.1% and 6.8% of all recommendations.
The ABR suggests buying Nvidia, but making an investment decision solely on the basis of this information might not be a good idea.
The overpriced stock isn't going to continue to draw more money into the stock, and it may be time for the stock to enter a correction, with the risk of a short-term pullback increasing.

Is the oil outlook optimistic for the coming months?As 2025 approaches, traders are considering the potential impact of Donald Trump’s presidency, China’s economic efforts, and OPEC+'s gradual easing of production cuts.

Is Tesla's Stock Flying Too High?I think the stock remains sought after in shorter time cycles. So you want to make money but you don't want to chase the stock high and purchase it, you can choose a short cycle option trade.

Options StrategyThe precious metal has slid against stronger U.S. Treasury yields, with the market looking ahead to 2025 for fresh catalysts. Market pessimism around the prospect of significant U.S. interest-rate cuts in the new year have kept consistent downward pressure on gold prices in late December, reflecting hawkish Federal Reserve commentary and the inflationary nature of many of President-elect Donald Trump's mooted policies. Higher interest rates for longer typically damp the appeal of non-interest bearing bullion.

Equities Could Rise Further in 2025Will there be a bigger bubble in the rising stock market?
Unbelievably, on a technical analysis level, the rise has not come to an end.

ETH is now showing bearish signsA clear move below the $3,300 support might push the price toward the $3,250 support. Any more losses might send the price toward the $3,220 support level in the near term. The next key support sits at $3,110.

Key factors affecting stock performance in the near future.Rather than focusing on anything else, we at Zacks prioritize evaluating the change in a company's earnings projection. This is because we believe the fair value for its stock is determined by the present value of its future stream of earnings.
When earnings estimates for a company go up, the fair value for its stock goes up as well. And when a stock's fair value is higher than its current market price, investors tend to buy the stock, resulting in its price moving upward. Because of this, empirical studies indicate a strong correlation between trends in earnings estimate revisions and short-term stock price movements.

Election uncertainty surgesThe retreat by traders underscores concerns about market volatility ahead of the election, with Bitcoin prices highly responsive to political dynamics.

New Risk: A Trump DefeatMarket volatility soars ahead of elections.
Currently down six consecutive days; down 9.76% over this period.

Key points:Polls show tight race, keeping markets on edgeStock markets moved sideways and an uneasy calm settled over currencies and bonds as investors waited for the United States to choose a new leader with polls showing the contest on a knife edge.
I think XAUUSD will rebound moderately.

Possible Skyscraper on USDCADwe broke monthly resistance. If we can close above this level in the next 8 days, we are looking at around 1100 pip gain from the retest.

Ripple / XRP AnalysisXRP price today is $0.39 with a 24hour trading volume of 1.2 billion dollar. XRP price is up 1% in the last 24 hours and 11% since last week
In the daily timeframe, the price formed an ascending price channel pattern, and after being supported by the lower trendline, it started moving upward. However, the $0.4 resistance level has paused the rally for now, resulting in short-term price consolidation.If xrp surpasses the $0.4 level, the channel’s middle trendline and the $0.5 levels will be the next obstacles to surpass. On the other hand, if the $0.4 level rejects the price, the channel’s lower boundary will be the next significant support level. short term targets are 0.43 , 0.45 , 0.47 and 0.5$
Ripple Moves 100M XRP amid growing whales Interest in asset plus xrp overtakes BTC and ETH in terms of trading Volume in Australia

Moving averages are working.Investors holding positions at high levels are in the most dangerous position. The higher the leverage, the greater the price fluctuations, the more difficult it will be for the investment account to withstand the huge retracements and eventual liquidation.
