Total Update on TOTAL. #TOTAL CRYPTOCAP:TOTAL Looking at the Weekly bearish rotation with 12/26 emas cross, hanging on for dear life on Day Yellow support. Next, Stop a double bottom at My weekly Orange target at 879.B #crypto #CRYPTONEWS #cryptocrash #cryptomarket CRYPTOCAP:BTC #BTC
Total

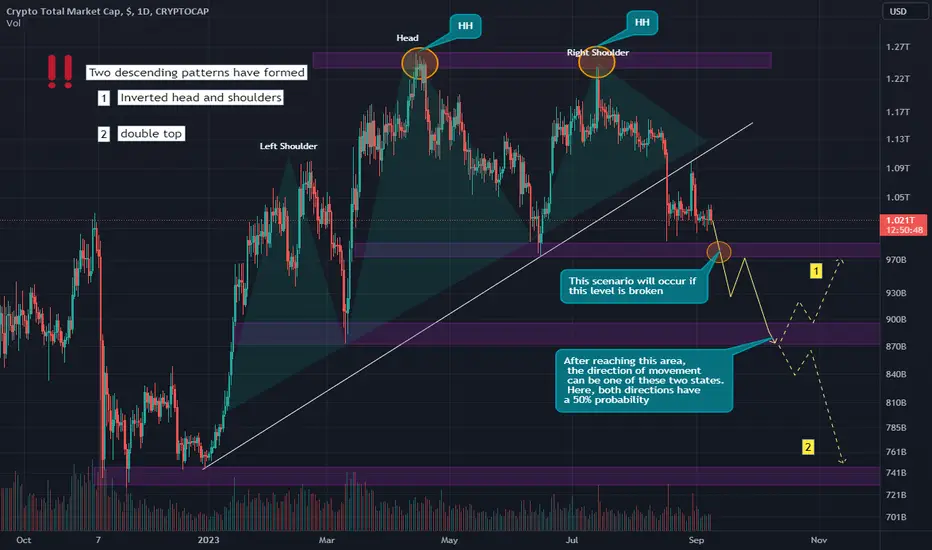
total cryptoTotal has faced a heavy fall and will fall in the near future. Everything is clear in the picture. It has formed two negative patterns, both of which are very strong patterns
Bitcoin long : 2 targets.First target 27k and second target 28k.
I think 27k is easier to catch , but if anything drastic happens in the markets 28k should be considered as a good option.
Use proper risk management . Longing at these levels is risky.Overall my bias stands for more downside. I just like the setup and i think its worth taking the risk ,if btc goes down i still make money , i still have short positions opened from 30400$ region.

Navigating the #TOTAL Market Cap: A Glimpse into Crypto's Future💎The overall health of the cryptocurrency market can be gauged by examining the #TOTAL Market Cap, making it an essential chart for traders and investors. Delving into the #TOTAL weekly chart, the long-term perspective remains optimistic. Notably, the downtrend trendline representing the average price has been breached, accompanied by the formation of a new Higher High. Such developments hint at a potential transition from a bearish to a bullish trend.
💎Post-breakout, the market entered a consolidation phase lasting four months. During this period, the price oscillated between the 1.235T resistance and the 1.000T support. Currently, #TOTAL is undergoing a retest of the significant 1 Trillion mark, which aligns with the Volume Profile support, reinforcing its importance. If this Demand Zone remains unbreached, we might be on the cusp of a substantial 60% surge, targeting the 1.6T resistance. The strength of this resistance is underscored by its alignment with the 327.2% and 38.2% Fibonacci retracement levels.
💎It's worth noting that making long trades now could be akin to catching a falling knife. Nonetheless, our objective at the MCP team is to highlight these pivotal market shifts. By doing so, we hope to empower you to discern bullish indicators promptly, ensuring you maintain a competitive edge in your trading decisions.

TOTAL UpdateTOTAL is dump lower than i expected.
But still, i ain't believe that we're gonna trading below 1T, but if it's happen, i'll call it a fire sale.
Trade safely.

$BTC good long term case BUT where does support form?Long term BULL + Short term BEAR case
CRYPTOCAP:BTC is once again making a case for BULLS, at least short term.
We'll see what happens.
The 4Hr RSI getting stronger & can be seen on daily charts.
Longer term #BTC is making a GREAT case for bulls. But can take some time.
However, don't be naive. The current area is not the best place for #bitcoin to build a SUPPORT level, 25k much better.
BUT, it can, of course.
These are support levels for CRYPTOCAP:BTC to build upon.
For BULLS, 25k is BEST. However, it doesn't kill cause if it goes lower.
23.5k can be satisfied by the trend line.
Gap top is 21k & the Gap bottom is 20k.
Don't think the SUPER LONG TREND is in play, white lines, but who knows.

Crypto Market CapThe Total Market Cap , BTC and Altcoin Market appear to be breaking out of crucial long-term levels. Certain market conditions have to be met for either a bull-run trigger or bear-cycle continuation, based on the degree of economic stability and certainty in it. I'm going to discuss critical technical levels and their implications, as well as my fundamental views for the year.
Bad Outlook for Q3/Q4 of 2023:
Equity market health and controllable inflation would aid crypto development in the long run. So far the battle against inflation and stock market health have been promising. However, by considering the following 3 factors the outlook may rapidly change:
Fading AI hype
The end of the U.S. presidential election stock rally cycle, which occurs in the year after midterm elections (last midterms were in Nov 2022)
In Q3 of 2023 (particularly August and September) there is historically more consumption due to the beginning of a new academic year, implying further inflationary pressures and more gov intervention
1) Consumer spending accounting for >2/3 of GDP and 2) currently being discouraged through prolonged high interest rates - amplify my positive GDP growth expectations = more inflationary pressures.
Technical Levels with fundamental evaluation:
I believe long-term levels are crucial for trend analysis. We're currently testing multiple levels simultaneously. Due to my pessimistic views for the upcoming months I am bearish in the short-run and bullish in the long-run. From current price level I'd expect +- 30% drop (below 20k), shown in figure 1. If we do go to the upside, we could see a 60% short-term price gain, presented in figure 2. Either way great volatility is to be witnessed.
Figure 1
Figure 2
I hope you took away some important points. Trade safe :)
Feel free to comment your opinion


TOTAL & BTC: Guide to Trend Line AnalysisHi Traders, Investors and Speculators of Charts📈📉
One of the most important parts of trading is following the macro phase and planning your trades. The only way to do this, is to pre-identify the macro market cycle that's currently playing out, as well as determine key zones of support and resistance. You do this by drawing up trend lines on the chart, from a macro perspective.
Here's a comprehensive Guide to Elliot Wave Theory, done on ETH :
To summarize if you're short on time, Elliot wave identifies upward and downward phases during an overall bullish or bearish cycle. Wave 1-2 can often correct a near 50% from starting point of wave 0-1. This means the price can drop -50%, and you would still be in a bullish cycle .
Now that we've discussed Elliot waves, we can also take a quick look at Wyckoff Method for BTC, which I did over here:
In other words, don't be scared of corrections! Wait and plan your trade. There's no need to force a trade. If you have identified your support and resistance zones with diagonal and horizontal trend lines, you can wait for the price to reach your target and execute a brilliant trade with a great risk-reward setup.

Golden Pocket Rejection We dropped down to a swing failure pattern May 12th. (a long wick down). We then sprang back up on the 15th to create a small range for the month of May. The low and high of that range used to pull the fib and find a golden pocket at 1.15 trillion . We have left that range long ago but since rejected from it twice. I wonder if we will retrace to the POC below and continue ranging? My gut says we go down but that doesn't mean anything really.
Now here's the thing. If you zoom out 100% and draw a fib from the lowest low to the highest high you will see the golden pocket is.........1.15 trillion. I cant make this stuff up.

TOTAL Crypto Purchase !!!Global Zone 1.008T-709.181B
Purchase level 869.515B
Local area 873.661B-657.391B
Purchase level 775.162B
Sweet Shopping Zone 857.15B-741.039B
Secret purchase level 737.157B dotted line!

Will SEC witchunt kill TOTAL3?! What does it need?? SEC wants to crack down on crypto market
This is a means to control the flow of money. Every nation across time does not want to see their money flow out of their 'bloc'. If Binance continues to be a behemoth in the new finance space whilst CZ is in China.. this will continued to be perceived as a threat. I dont have extra information into Binance but regardless the Western bloc doesnt want Binance to be taking retail or corporate USD/EUR/GBP/AUD/CAD/etc en masse. Just as China does not want US tech companies to dominate a space like search for Chinese people.
This will consolidate the market
If SEC is successful (i dont know if they will be) then it will consolidate the market. This consolidation can be great for TOTAL3. Personal views aside if the flow of money is clear for larger actors then floodgates can open. From retirement funds to sovereign wealth funds to even treasuries.
Who would lose ?
Many altcoins could be damaged beyond point of recovery. Recovery I mean getting back to where they were. Many can dwindle into obscurity and became harder and harder to participate in. The real loser out of a consolidation of the crypto market will be retail and class mobility.
What to do about it ?
The upside potential of many smaller altcoins can easily tempt many to dump their bags into those with greatest upside. Regardless of SEC and regulation these smallest ones have the most risk. It is important not to be too lopsided in high risk crypto when crypto itself as an index is down 70%+ ie 3.3x to highs. There is plenty of gains out there within the bigger players who are more likely to rise above regulation and be where money is pushed to.
Who wins ?
As I imagine will be the case for at least another 10+ years.. the winner will be bitcoin. It will be hard to stop. Even anti crypto regulation will help bitcoin. It may be the biggest and seem like the least upside but it is increasingly important to have some exposure to the sun. Sun=BTC.

BTCUSDTThe 4h divergence continues. Bitcoin is waiting for another attempt to make a jump. I'm waiting for a test zone 30700-31300. A wedge is a good sign of a new move up. Good luck to all

BTC Cycle Review: know when to hold 'em & when to fold 'emReviewing the time around the halving that produces profitable trending signals.
From the chart 1 yr and 2 months before the halving and 1 year 5 months after the halving produces profitable signals
consider pre halving to be spring
consider post halving to be summer
consider the red X between the two to be winter and unprofitable to take signals.
Posting this up as reference into the next cycle. interested to see how this plays out.

Bitcoin | Extra Ordinary TimesA few months ago, Bitcoin experienced a near-death situation.
Very few of us realized the importance of that event, and the risks that were involved.
And now, even though Bitcoin has moved far from the bottom, it is still on the edge of a blade.
We have heard it on the news. Bitcoin has broken even. Everybody who has held Bitcoin is on average profitable. It is these "average" moments that are the most extraordinary.
The average Bitcoin Address (let's assume that 1 address = 1 trader) is in a precarious spot. The wealth accumulated in Bitcoins has been growing inside a bearish wedge pattern. Now, an important trend shift may be playing out.
The wealth in each traders' account looks poised to drop. It has been a good decade fellas!
The lesson for today: don't be like Bitcoin. Always remember to watch your step.
BUH-BYE

The Crypto Market Shakeup (#TOTAL): Breaking Through Key Support🌴 Paradisers, let's delve into the recent developments surrounding the Crypto #TOTAL Market Cap and its potential implications for the cryptocurrency market. 🌴
💎 A significant event has occurred as the Crypto #TOTAL Market Cap broke through a crucial demand area, signaling a potential shift in the overall trend. Adding weight to this observation, a confirmed Head & Shoulders reversal pattern has emerged, indicating that bears have gained complete control. This situation undoubtedly favors the continuation of the downtrend, presenting a rather negative outlook for the crypto market.
💎 At present, a minor pullback would be deemed beneficial for market health. It is anticipated that CRYPTOCAP:TOTAL will reach the previous demand level, the current supply zone, and the downtrend trendline. Should this scenario unfold as expected, it is likely that whales will begin accumulating short positions, leading to a consolidation phase. This consolidation phase sets the stage for #TOTAL to approach the $950B support area, completing the Head & Shoulders pattern and potentially dropping further to the $876B level. In the event that downtrend pressure remains robust, the final wave down could drive the price as low as $800B. Importantly, this support area finds confirmation from the 88.6% Fibonacci retracement and the Volume Profile level.
💎 However, it is crucial to keep in mind that the bearish scenario will hold true only if #TOTAL fails to breach the $1.138T resistance, which previously acted as a bounce point off the downtrend trendline.

Crypto Total Market Cap (TOTAL) can jump by over 40%💎 This is a follow-up on our last #TOTAL forecast, where we anticipated the continuation of the downtrend but considered an alternative scenario as well. Now, the tide has turned as the bulls conquered the supply zone, making our alternative scenario the main focus.
💎We witness the fascinating transformation of resistance into support, with #TotalMarketCap trading close to the long-term uptrend trendline. As long as we avoid a new lower low on the daily chart, the crypto total market capitalization is poised to surge further.
💎This could mark a significant uptrend, particularly since our critical resistance is positioned near 1.6T, a staggering 40% above the current demand zone. Paradisers, take note that this bodes well for the overall cryptocurrency market, and certain altcoins may experience growth of x5, x10, or even more in the upcoming weeks.
💎The MCP team diligently monitors the current support while unearthing those precious crypto gems. Stay tuned as we navigate the exhilarating crypto landscape! 🌴

TOTAL (Cryptocurrencies Total Market Capitalization) Analysis Fundamental Analysis:
The TOTAL or Crypto Total Market Cap is an integrated Complete Cryptocurrencies Market capitalization of all the Crypto coins and tokens and it is demonstrated against USD to show the total market capitalization of the entire crypto environment and it can be used for many speculation and hedging purposes in finance and other related sectors.
it can simply interpreted as how much of fiat currencies has been spent or converted to the Crypto assets or how much is the total value of the entire crypto environment is worth presently in Dollars.
by looking at this index and comparing it with the entire worlds market capitalizations we can understand how much more fiat currencies are there in the world to gets converted to the Crypto or the other way of looking at it is how much more time it takes to Concore the fiat world by crypto and decentralized open markets.
TOTAL Chart includes all the Coins and Tokens i.e BTC,ETH...
Technical Analysis:
we can see that, the chart is currently at the Reaccumulation zone of Fibonacci Golden zone and it has formed Bullish Divergence with MACD Lines and Histogram, which is the sign of Bearish or Retracement wave end and Trend Change to the Next Bullish Cycle and start of the next Impulsive wave.
we have specified the Fibonacci retracement levels which can be used as the significant Pivot Points and Support areas where it can be the best Price or undervalued price to Purchase and Invest on.
there total of 3 Targets defined by Fibonacci Projection of the initial impulsive wave followed by its retracement after the Top Distribution.
the 3 Target gets confirmed as the price triggers the 2 TP followed by some retracement and price correction.

TOTAL (Crypto Total Market Cap) Index Analysis 05/01/2022Fundamental Analysis:
a very simple way of Fundamentally analyzing this Index is to look for the other markets indices including US and Europeans ones, such as Dow Jones and S&P 500, it is very observable that these Equity Markets are very much inflated and shall Retrace to the lower levels and correct themselves and get converged to their intrinsic values.
in other word we can say the liquidity shall get diverted from these markets to some other Asset Class, this means gold and silver as well as Digital Assets which are Cryptocurrencies and their underlying technology such as Blockchain and even their future Projects like DeFi and related Financial and Applied Areas.
By looking at the current statues of the Equity Indices and analyzing them we can come to the conclusion that these markets are doomed to fall soon hence a massive transaction of their liquidity to these new Asset class.
lets look at some of our analysis on these Indices such as DJI:
US 500:
it seems very obvious to us that the collapse of these markets shall Couse a huge rise on other alternative markets
assuming the minimum retracement or fall of 20% for each market and considering their Market capitalization of 40.7 Trillion for US500 and 10 Trillion Dollars of DJI and of course the market capital of other European markets.
the Domino effect of markets fall shall consequences to the other markets fall around the world, we can expect minimum of 4 to 10 Trillion dollars of Liquidity shifts from these markets to the Crypto currencies Industry and ecosystems.
these massive amount of liquidity shift shall Couse a huge pomp and rise in the new and even old Projects on various sectors of Crypto world.
mean while we may have some more fall of the Total Market Capitalization of cryptos to lower levels due to some existing fear and Rug pool and Scam Projects but these events should not be having any long term effect and can get recovered on a very fast pace.
the other factors of the wealth transition to the decentralized finance world can be the totalitarians policies and dids of the different establishments around the world such as China, India, middle east counties, or even the implode of some dictatorships systems Like turkey and Iran which will drive the Public funds to more stable and liquidly asset class such as cryptos.
the world banking system too has lots of over leveraged Projects which can be liquidated and Couse a huge market collapse and distrust with their investors the public which will eventually Couse the wealth transition to the decentralized transparent venues such as Blockchain based Cryptocurrencies.
Technical Analysis:
There exist A Hidden Bullish Divergence of Price with MACD, it occurs on a Bullish trend and it is a very significant Sign of Bullish trend continuation.
the Hidden Bullish Divergence is specified with the Green connecting lines.
we draw the Fibonacci retracement from the low point of 0 to the ATH where we can see the dips of the Price falls are having perfect confluences with the Retracement Levels of Fibonacci hence we defined our two Targets using the same Fibonacci extension Levels.
as the Markets fall chances are still exist, we can use the retracement levels of the Fibonacci to specify the support areas and the market Reaccumulating zones for its new bullish trend initiations.

Bearish 5-0 on (Total 3 Excluding - LTC and Stablecoins)There is a Bearish 5-0 visible on the Daily on the Total Market Cap Ex- BTC, ETH, LTC, and the two big USD-based Stable Coins; if it plays out, I think Total 3 will make a new low that will likely take it down to the macro 0.886.
We also have some Hidden Bearish Divergence on the RSI to back it up.

BITCON, TOTAL MARKET CAP & DXY - POSSIBLE BEARISH SIGNSI know the sentiment of late has been very bullish on crypto especially with the Blackrock ETF on the horizon. They just resubmitted their ETF application to the SEC for review today and approval of this would very likely cause a crypto boom. However, the Total Crypto Market Cap is showing signs of weakness which is causing me to reassess our current situation. Until the approval of this ETF, the market is fair game. Given the overall bullish sentiment in the market, a strong pullback would make sense to check the market and close some over zealous longs. The DXY has also had a very hard sell off. A small recovery could also cause further downward pressure on the crypto market.
Looking at the chart for Total Market Cap, I've outlined the bullish inverse head and shoulders we have forming. However, the right shoulder has made a lower high followed by a nasty sell wick back below the neckline. I think it is possible that we see a sell off here as we form more of a bullish continuation pennant in this right shoulder before take off. The daily MACD also just crossed bearish and has been signaling some bearish divergence compared to the price action.
The DXY chart (which will be included below) also had a strong sell off last week. A small recovery might be in store and this would add further selling pressure on BTC and the crypto market as a whole.
I want crypto to moon like everybody else, but the tea leaves are signaling the time might not be just yet. Keep your guards up and protect your funds because you'll want as much as possible in crypto in this next boom. LFG!!

TOTAL2 CRYPTOCAP Once again at the 21W MA.
What will happen next? I know what I will be doing: waiting for the system to give me another entry signal.
Se you soon

The Real Golden Pocket is 1.15 T Total Market full chart 100% zoomed out Fib from low to high = Golden Pocket 618 at 1.15 Trillion.
Guess where we just rejected from? hmmm....
