Total Market Cap Weekly Chart: Ready to Explode?Hey traders! Let’s dive into this weekly TOTAL Crypto Market Cap chart. The headline says it all— Total Market Cap Is About to Explode , and we’re here to break it down!
We’re seeing a massive expanding triangle formation, with the market cap currently at 3.21T , right at retest of triangle resistance. Historically, these patterns have led to parabolic moves — check out the 2019 - 2020 breakout! If history repeats, a breakout could send the market cap soaring toward 8.0T or even higher!
However, if the breakout fails, we might see a pullback to the previous level of support around 2T .
Key Levels to Watch:
Resistance: 3.66T (ATH)
Support: 2T
Breakout Target: 8.1T+
Breakdown Risk: 1.20T (latest strong resistance below 2.6T)
Is the market cap about to go parabolic, or are we in for a fakeout? Let’s hear your thoughts below!
Total

$TOTAL Crypto Market Cap - Banana Zone or Bull Trap!?Massive day for CRYPTOCAP:TOTAL Crypto Market Cap with 9% move UP, breaking above the 200DMA and last cycle’s ATH.
Got rejected at the .618 Fib ~$3.19T, so work still needs to be done to confirm this region.
Expect a retest at $3T to decide if the market goes to $3.2T or back down to $2.85T
As I've been saying this past month, this is either the biggest bull trap all cycle, or it's the start of the PARABOLA 🍌

Crypto Total Market Cap. Simple Signals (New All-Time High Soon)On April 22 TOTAL moved above its 3-Feb. low after trading below this level for some 50 days. Moving above this low is a major bullish development. A very strong yet simple signal.
On April 22 TOTAL moved above and two days later, on the 24, this level was tested as support and holds. The session ended with long lower wick.
The candle 30-April produced a higher low compared to 3-Feb. and this is a major bullish signal. This one here reveals that TOTAL is set to challenge the next major resistance point. This is all happening with a very strong RSI.
The strong RSI is another simple signal and cannot be denied. TOTAL is now moving towards a new All-Time High, and this ATH will happen very soon, likely mid-term (within 3 months).
The next resistance after the advance that will happen in the coming days will happen around 3.25T. This is a mild resistance and should break after some bullish pressure. This will be followed by a challenge of the previous ATH as resistance. It will be pierced right away through a wick and then a new price discovery session will develop.
» The entire Cryptocurrency market is bullish right now and set to grow. The grow is already happening since early April.
Thanks a lot for your continued support.
Namaste.

$TOTAL Crypto Market Cap BULL TRAP AlertBULL TRAP 🚨
New money has been coming into the market as shown on the Crypto CRYPTOCAP:TOTAL Market Cap, hence why you haven’t seen “rotations” in coins, but it appears to be drying up.
There’s been major resistance at the 200DMA, which is just below the previous ATH at $3T, and PA is being squeezed between the 9DMA.
Combine this with a heated RSI, it appears to be a bear flag in the making.
The trendline from Oct. ’23 gives confluence with the 50DMA as support.
*The only savior I see at this point is price smashing through the 200DMA and flipping support into the green accumulation box.
Regardless, this move is coming to an end later this week to test support or breakout.
Again, I’ll reconfirm my stance that this is the most obvious bull trap I’ve seen all cycle. Although I hope to be wrong 🥲
Having said that, after support is confirmed on the move, we are going to VALHALLA 🚀
Bookmark this 🤓

Altcoins, Crypto is different since institutions came inHow long have we been saying this? Yet the masses have not grasped this concept. Neother have influencers. But that makes sense because they need clicks to survive. People tend to "graze" where pasture seems greener, even if it isn't.
CRYPTOCAP:TOTAL 3 = NO CRYPTOCAP:BTC or CRYPTOCAP:ETH
Altcoins have been in a steady incline since Nov 23.
Daily
The last 2 consolidation phases lasted AROUND 6 months, depending on where you begin the consolidation phase.
Weekly
Not important going further as Crypto landscape has changed & the back data is irrelevant. However, let's be nosey & see how it looks in comparison.

Altcoin Market Update – April 24, 2025As of today, the TOTAL3 Index (excluding BTC & ETH) offers key insights into the altcoin market:
⸻
Technical Overview:
• 1D: -1.54% → Minor pullback
• 1W: +6.37% → Bullish momentum
• 1M: -4.14% → Mid-term correction
• 6M: +32.94% → Strong growth
#TOTAL3 remains above $790B, a critical support. Holding this level is vital for future altcoin rally targets like $1.16T and beyond.
Bullish divergence on the TOTAL3/BTC chart hints at altcoins gaining strength over BTC.
⸻
Fundamentals:
• The global crypto market cap is $3.03T
• BTC & ETH dominate, but TOTAL3 reflects altcoin potential
⸻
Summary:
Altcoin market remains optimistic, with solid long-term signals. Keep an eye on support zones and momentum indicators for your trading strategy.

The 4 Crypto Market Cap charts and SMA's comparedTop Left TOTAL CRYPTO MARKET CAP
Top Right TOTAL 2 CRYPTO MARKET CAP ( Minus Bitcoin )
Bottom Left TOTAL 3 CRYPTO MARKET CAP ( Minus BTC and ETH )
Bottom Right OTHERS CRYPTO MARKET CAP ( Top 125 coins Minus Top 10 by dominance )
50 SMA RED
100 SMA BLUE
128 SMA GREEN
TOTAL Cap is the ONLY one that has broken above the 2021 ATH and has subsequently dropped back under but is still "touching the line" with a Wick up from the current candle.
It can also be seen how it is only the TOTAL chart that has remained easily above the 50 SMA since late 2023. The toer charts can be seen to have needed to bounce of it in 2024
The TOTAL 2 & 3 charts have very similar Candle moves and 50 SMA use.
To me, this is telling us about the Higher Cap ALT coins.
The fact that both TOTAL 2 ( Minus BTC ) and TOTAL 3 ( Minus BTC and ETH ) are similar shows me the little impact of ETH on price rise. These Charts are held up by the Higher ALT coins like SOL, INJ, SUI, XCN, HBAR to name a few. Most of these are still less than 100% gains over the last 12 months.
But what the slight Difference there is between the two charts does show us that ETH is a burden. It is dragging the TOTAL 2 chart down lwoer than the TOTAL 3 and that difference, though small on a monthly chart, is VERY SIGNIFICANT
OTHERS tells a huge story of how the Mid to Lower Caps are paying the price of Bitcoins adoption by Corporations and the fact that, as a result of these Corporations HOLDING, Bitcoin Dominance remaining High. The money that has once been used to Feed the ALT Market is static.
OTHERS is also the only chart that has fallen below its own 50SMA
That is not Bullish and very clearly shows how the Crypto Market has now matured and the absolute Tidal wave of New, worthless, useless ALT coins are failing.
This does not mean that will continue but I am inclined to believe that while we have such uncertainty in the world, the utter risk of investing in something with no use or history and security does not appeal to many.
To many extents, this could be seen as the beginning of the " Dot Com" Bubble burst for Crypto, where the best Coins / Projects are adopted and the rest, well, fall aside......
We shall see

USDT Dominance Update (1H)First, it’s important to remember that USDT Dominance (USDT.D) tends to move inversely with the market. In simple terms:
— If USDT.D rises, the crypto market usually drops.
— If USDT.D falls, the market typically rallies.
On the lower timeframes, USDT.D has broken out of a descending wedge formation, which is generally considered bullish.
Additionally, a double bottom pattern appears to be forming and is on the verge of breaking out to the upside.
Taking all of this into account, USDT.D could potentially rise toward the 5.81% level — suggesting that the broader crypto market may experience a short-term correction.
This outlook also aligns with one of my recent Bitcoin analyses.
Be sure to check my latest Bitcoin breakdown to understand where the market might be headed next.
— Thanks for reading.

Starts Late, Ends Late: 2026 Bull Market?Market conditions are so different now. Everything is changing fast and radically, it has to do with the stars. The way the stars are aligned now has not happened in hundreds of years. The type changes we are seeing now have not happened in hundreds of years.
It is not only the financial markets but the whole world and the way we perceive reality is changing in so many ways. This is certain to have its effect on the Cryptocurrency market, the effect is already present and tangible, market conditions (reality) will never be the same.
The bull market is starting late. By this date in 2021, everything was up and up really strong. Some pairs had already peaked, literally, some altcoin trading pairs had already peaked by April 2021. The full cycle complete. Thousands of percentages of points of growth.
What about now? It is April 2025 and the bottom is in on many pairs. Only last week, 7-April, we had a marketwide bottom. The start of the 2025 bull market cycle and phase. A late start can translate into a late end.
Now, a full bullish cycle can be completed in 6 months. This is not necessary nor required. Also, the market is much bigger now, it wouldn't be feasible, there would be too much rush.
Think of the market as an entity that wants to survive, thrive, live and grow. Can it go through years of bearish action and only produce several months of growth? Balance is needed. The market needs a bullish cycle to keep the participants engaged or else everybody will quit forever if there is nothing to gain.
The fact that the Altcoins market hit bottom is the most bullish signal there is, but, looking at all these charts, hundreds of charts, something tells me that what is coming will be different to the past. Actually, it will be similar because the last bull market happened from March 2020 through late 2021. So we can have a bull market from April 2025 until some time in 2026. I just don't believe that everything will end too fast, within six months, because we are having a late start. It will be the other way around, the bull market will extend.
Instead of Cryptocurrency growing for 1 year, we might get continued growth for 2-3 years straight, maybe more for some pairs. Some pairs have been dropping for 4 years while others have been down for 6 years or more. When things change, these pairs will be experiencing sustained long-term growth.
Other pairs grew strong and never moved below support. These pair were supposed to drop according to classic past patterns and yet, they all remained strong and ready for more. This bull market will be out of the ordinary. Everything that is happening right now in finance and politics is not the same as always, it is a true generational change.
We are going through a phase of evolution and this is what will cause the bull market to extend. Late start, late end.
Namaste.

bitcoin dips below 60kbitcoin dips below 60k, but we're unfazed.
i see this playing out as we move into the depths of winter,,,
this crypto winter ❄️
why would this happen, you ask?
the answer is simple: a stop-loss raid.
a sharp wave 4 designed to shake out weak hands.
distribution may have already started, hypothetically speaking, but it'll take the rest of the year to unfold.
think of it like the jan 2021 -> april 2021 vibe, only on a slightly higher degree and timeframe.
---
take note of the highlighted wave 2's and wave 4's on my chart.
what i'm illustrating is "the law of alternation," which states:
if wave 2 is flat, wave 4 will be sharp, and vice versa.
all the wave 2's in this cycle have been flats,
so by design, all of our wave 4's are set to be sharps.
this fits neatly into the larger cycle:
sharp retracements triggered by over-leveraged positions,
yet consistently bought up thanks to strong demand.
with each sharp retracement, however, the upward moves become smaller,
as momentum gradually fades.
---
w4 target: below 60k
w5 target: between 150k-200k (conservatively).
---
ps. i have recently shared a much more bullish idea via:

Crypto Market Cap: Short-Term Pullback Before Major RecoveryTechnical Analysis
The chart illustrates a well-defined ascending channel for the total crypto market cap (excluding BTC), currently experiencing a downward retracement. The price action suggests a probable dip towards the lower boundary of the channel around the $969 billion support zone before rebounding significantly. This level aligns with previous price reactions and serves as a strong demand zone, making it a potential bottom before the market resumes its uptrend.
Fundamental Analysis
Liquidity Flow & Market Sentiment
The broader market has seen increasing stablecoin dominance (such as USDT’s market cap exceeding $130 billion), indicating risk-off behavior as investors move to safety. This suggests a short-term sell-off in altcoins before a reinvestment phase.
Institutional inflows into ETFs (like Ethereum and broader crypto ETFs) will likely drive the next bullish wave, but the current correction reflects temporary uncertainty.
Macroeconomic Factors
Interest Rate Policies: If the Federal Reserve signals rate cuts in mid-2025, risk assets (including crypto) will likely benefit from increased liquidity.
Regulatory Clarity: The market is awaiting key regulatory developments, especially in the U.S. and EU, which could influence capital inflows into crypto.
Altcoin Cycle & Market Recovery
Historically, the crypto market experiences phases of correction before a strong recovery. With the next Bitcoin halving approaching (April 2025), the overall crypto market cap is expected to rebound as bullish momentum returns.
DeFi, gaming, and AI-based tokens continue to gain traction, setting the stage for an altcoin-driven rally once risk appetite returns.
Conclusion
A short-term pullback to the $969 billion support level is highly probable, after which a strong bullish reversal is expected. Long-term investors might see this dip as a buying opportunity, anticipating a rally towards the upper boundary of the channel (above $2 trillion) as macroeconomic and institutional factors align in favor of crypto.

HOW IS CRYPTO SHAPING UP?Trump and tariffs have a firm grip on the economic world as of late, so where does that leave the crypto market?
TOTAL has a clear structure since the beginning of the bull market in 2023, in the last 3 days TOTAL has wicked into the bullish trendline support but sits within a bearish trend channel. This level also coincides with the bullish orderblock that started the leg up post US election so a very strong level of support here.
Do I think this is the end and the bottom is in? The chart would make a very good case for it however I believe that the Geo-politics outweigh Technical Analysis currently, at least in the short term. Everyone is watching for the latest news release/Trump announcement and all the time that is going on the market is very reactionary with less passive orders and more reactionary news based market orders. That taken into account in the short term this is a game of musical chairs with massive volatility swings and liquidations left right and center, a traders dream.
I'm very interested in how the FED will react to this, once we start getting emergency or early interest rate cuts that for me is when BTC will take the next step up and will flip to an investor/buy and hold environment, whether that's from here, lower or higher I'm not sure but but BTC needs a risk-on environment to thrive and Trump is doing his best to force J Powells hand.

TOTAL Bearish PennantThe Parameter known as TOTAL has a currently working bearish pennant formation.
Market is bearish and every green candle on Total means another Short opportuinty.
If Total breaks 2.58T (which is a montly pivot value), we can expect more dumps. 2.36 would be the main target.
When Total reachs 2.36, look for a long wick. If the daily candle close isn't happening, it's a Long opportuinty.

Massive storm hiting the crypto market soon!The Correlation Between SPX500 (Wall Street) & Crypto 📉📈
The relationship between SPX500 and crypto is not always stable. Sometimes they move in sync, like the Earth and Moon, and other times, they are completely decoupled. But rarely, we get an eclipse—a moment of total disconnection.
And guess what? That’s about to happen.
🔎 What’s Happening?
Looking at the charts, SPX500 had a massive rally last year, but while Wall Street boomed, crypto was bleeding. Most altcoins were slaughtered, and the TOTAL crypto market cap suffered.
But now, SPX500 is overbought, while crypto is oversold.
👉 This time, the decoupling will work in crypto’s favor!
💰 $2 Trillion in Sidelined Cash Ready to Flow In
Right now, about $2 trillion USD is sitting on the sidelines—money that institutional investors are hesitant to deploy due to market uncertainty. Many are keeping their funds in USD or foreign bonds instead of taking risks.
However, if you check my April/May forecast, we can see that:
✅ Crypto will be deeply oversold (confirmed by RSI & weekly MACD crossover).
✅ The US Dollar is weakening, forcing investors to move their money into other assets.
✅ SPX500 turning bearish = capital rotating into crypto.
🚀 The Perfect Storm for Crypto
📉 SPX500 bearish
💵 USD weakening
📈 Crypto bullish
This creates the perfect setup for rich investors to flood the crypto market with fresh liquidity.
💡 What does this mean for prices?
- CRYPTOCAP:BTC could double (100% gain).
- Altcoins could skyrocket (x10 to x100).
- This would finally trigger the altseason we’ve been waiting for—the parabolic move that happens once every four years.
📆 Timeline: April – June 2025
This move will be so explosive that it will eventually trigger a correction—possibly leading to a bear market. However, since crypto now moves in 6-month cycles, this correction should end by December 2025, setting up another leg up.
🏁 Final Thoughts
This kind of SPX500 & crypto decoupling is extremely rare, so positioning before the rotation starts is crucial.
⏳ Exact timing? Hard to say. But April/May looks like the moment when everything aligns.
🚨 DYOR as always—anything can happen to invalidate this idea.

I think we will see 1.7T in 2026.The most probable scenario in my head.
* What i share here is not an investment advice. Please do your own research before investing in any digital asset.
* Never take my personal opinions as investment advice, you may lose all your money.

USDT Dominance New UpdateIn short time frames, USDT.D has formed an Head and Shoulders pattern. If the neckline is broken, we expect a little dump in here which will make some of alts recover for a short while.
Due to BTC dominance is a lot higher than a week ago, I consider to long Bitcoin only.

ALTS MARKET CAP ANALYSIS. Altcoin Market Cap Analysis: Potential Rebound or Breakdown?
The altcoin market cap is currently bouncing off the support trendline of its ascending triangle pattern, which indicates a potential bullish continuation.
Ascending Triangle Support:
The market cap is testing a key support trendline within an ascending triangle, which is typically a bullish formation.
Sustaining above this level strengthens the case for a breakout.
Ichimoku Cloud Indicates Bullish Momentum:
The Ichimoku Cloud is turning supportive, which indicates an improving market sentiment.
A move above the cloud could confirm bullish momentum.
Possible Scenario:
If the price sustains above the trendline, the altcoin could see a strong bounce, leading to further gains.
A breakout above the resistance level of the triangle would confirm a larger uptrend.
A break below the support would invalidate the bullish structure.
This could lead to a deeper correction, which indicates increasing risk.
If you found this analysis helpful, hit the Like button and share your thoughts or questions in the comments below. Your feedback matters!
Thanks for your support!
DYOR. NFA

Is the Total Crypto Marketcap gearing up for a major move?A few months ago, the total crypto market cap surged past its previous highs, reaching a new all-time high of $3.7 trillion.
The current pullback appears to be a bullish retest of the breakout level, potentially setting the stage for the next upward leg.

Lets Make Life Changing Money TogetherMartyBoots here , I have been trading for 17 years and sharing my thoughts on CRYPTOCAP:OTHERS .
.
CRYPTOCAP:OTHERS is looking beautiful , absolutely beautiful and a very interesting chart for more upside, it is now getting into support. Just like NASDAQ:AMZN did back in 2008.
Do not miss out on CRYPTOCAP:OTHERS as this is a great opportunity to make life changing money on ALT Coins.
Regulation is going to moon this market
Be Ready
Watch video for more details

(TOTAL) total crypto mcap "candles on record [history"worst red candles on record in the past four years and various progresses of positive growth measured from lowest in between points.

White House Crypto Summit 2025Today on March 7th the White House will host a Crypto summit for the first time. This summit is expected to host
many prominent figures in the space, here are some of the main ones:
Michael Saylor Founder of Strategy.
● David Bailey CEO of Bitcoin Magazine.
● Matt Huang Co-founder of Paradigm.
● Zack Witkoff Co-founder of world liberty financial
● SEC Chairman Paul Atkins
● Changpeng Zhao (CZ) Co-founder of Binance.
● Kyle Samani Managing partner at Multicoin Capital.
● Anatoly Yakovenko Co-founder of Solana.
● Charles Hoskinson Co-founder of Cardano.
● Sergey Nazarov Co-founder of Chainlink.
● Brian Armstrong CEO of Coinbase.
● Vlad Tenev CEO of Robinhood.
● Arjun Sethi CEO of Kraken.
● Kris Marszalek CEO of Crypto(.)com.
● Brad Garlinghouse CEO of Ripple.
Trump is expected to sign executive orders at 3PM EST during the summit but what these orders are is not confirmed as of yet. I would speculate the "Strategic Reserve" including BTC,ETH,SOL,XRP & ADA would be an EO in some capacity as all of the founders/CEOs of those projects are in attendance. Perhaps regulatory framework, a tariff based system to reward US based crypto projects? In truth the specifics are unpredictable.
What we do know is that each of the major announcements have been sell the news events, as the saying goes "Buy the rumor, sell the news" and that has been true so far. Will this be a repeat? This summit so far has not had a rally going into this event, the charts show that BTC and the broader market have pulled back and retested last years chop range high after a liquidity sweep of previous ATH. Altcoins fairing worse than Bitcoin but structurally very similar. I do think the bearish structure of the HTF chart has many worried, sentiment is very low and many see the sell off continue. Either this is a genius way to acquire cheaper coins for the upcoming reserve or many will be caught offside or sidelined.
For now I am not taking sides, there is no clear read on this event for me but I can guarantee huge volatility on the low time frames, whether this leads to a meaningful move on the high time frames is yet to be seen.

5 Billionaires Enter The Cryptocurrency MarketFive new billionaires are entering the Cryptocurrency market and bringing billions of dollars worth of capital in. These are not the same participants we are familiar with. These are in and still playing. I am talking about players that have never played before. Each participant will bring in capital in the tune of 2-3 billions. This can make a huge difference.
Just 1 billion USD can create a noticeable effect on the price and dynamics of Bitcoin and the Altcoins market. When you inject 10 to 15 billion of new capital, the results can be something palpable.
In the short-term, this is bigger than the Crypto Strategic Reserve because it affects the entire market and not only a few projects.
You have the chance to be in, ALL-IN, before this massive injection of force.
This is Master Ananda, and I am here for your entertainment and continued support.
Namaste.

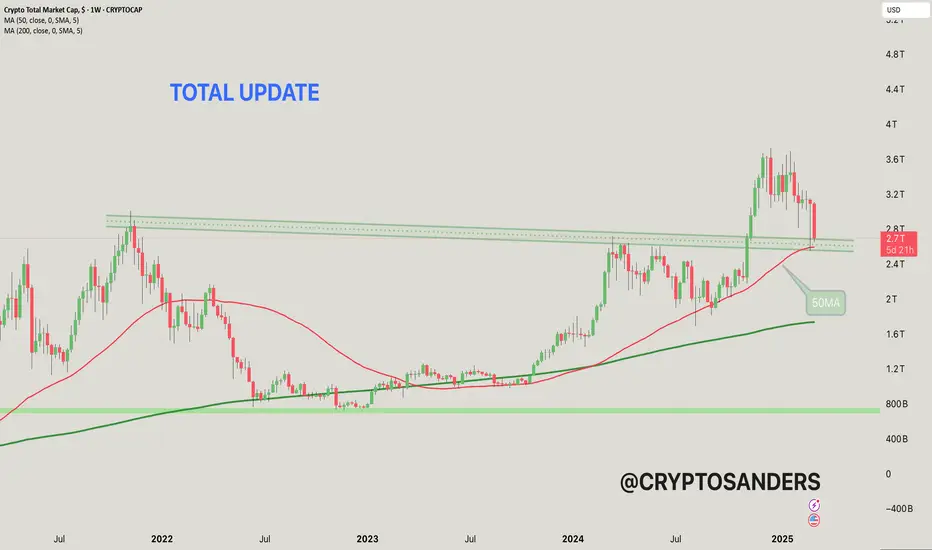
This chart shows the total cryptocurrency market capitalization,
The current value is around $2.271 trillion, which represents a significant drop of 12.51% from the recent peak.
50-MA (moving average): The red line represents the 50-week moving average, which is currently around $2.59 trillion. It acts as a short-term trend indicator and potential support level.
200-MA: The green line represents the 200-week moving average, which is around $1.73 trillion, which indicates a long-term trend and strong support level.
The horizontal green lines represent support levels around $2.4 trillion and $2.6 trillion. These levels are important for a potential bullish reversal if retested.
The dotted line above the price represents resistance levels near historical highs.
The recent decline suggests the market may be in a bearish trend after failing to break the resistance levels.
If the price is above the 50-MA, it could signal a reversal towards the resistance zones and a potential recovery. However, a break below the 50-MA could signal further decline. Keep an eye on the key levels around $2.4 trillion (support) and $2.6 trillion (resistance).
If you found this analysis helpful, hit the Like button and share your thoughts or questions in the comments below. Your feedback matters!
Thanks for your support!
DYOR. NFA