Cathie Wood predicted Bitcoin will be 500 k in 5 years, but ...In the past 24 hours, all crypto enthusiasts talk about " Cathie Wood predicted Bitcoin will be 500 k in 5 years".
But she mentioned two Ifs:
1- Her price prediction depends on whether companies continue to diversify their balance sheets into bitcoin, the biggest cryptocurrency by market value, and whether institutional investors begin to allocate 5% of their funds to it.
2-She said, "because countries are now deeming it legal tender." El Salvador recently made bitcoin legal currency, while Panama and Ukraine are said to be doing the same.
Now, let's dig deeper into this:
In 2020, GDP for El Salvador was 24.61 billion US dollars. Ranked 103 in the world. Very, Very, Very small (less than 3% of Bitcoin market cap)
In 2020, the GDP for Ukraine was 153.8 billion US dollars. Ranked 57 in the world. (less than 16% of Bitcoin market cap)
In 2020, GDP for Panama was 53 billion US dollars. Ranked 70 in the world. Very, Very, Very small (less than 6% of Bitcoin market cap)
Cryptocurrency adaptation:
At the end of Q2 2021, global adoption has grown by over 2300% since Q3 2019 and over 881% in the last year.
But the biggest problem is " Bitcoin losing its dominance in the cryptocurrency world and smaller market cap coins are more attractive for new crypto enthusiasts!
In other words, People have already started looking for the next bitcoin..!
Solana
Cardano
Chainlink
could be good examples for this effort..!
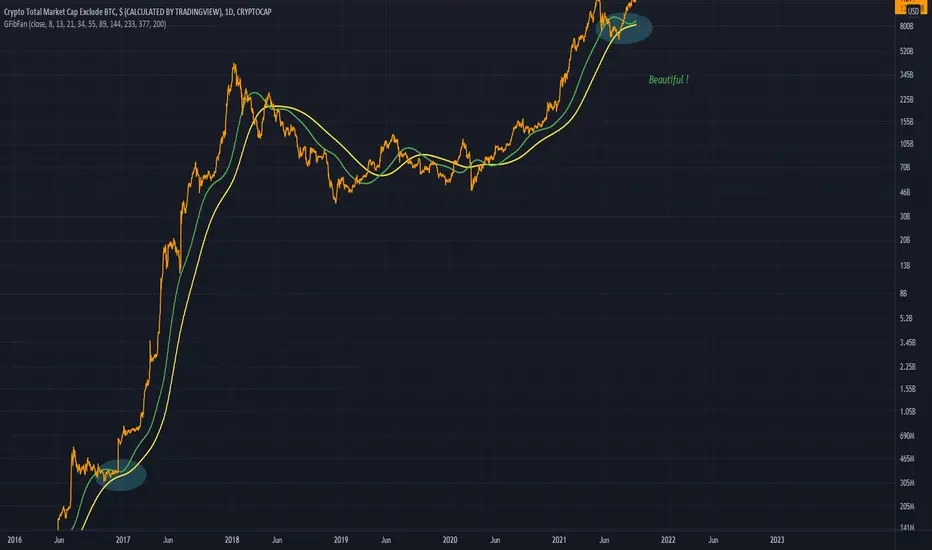
Bitcoin Market dominance Chart:
This chart clearly shows bitcoin losing its dominance..!
I believe anyone who believes Bitcoin could reach 500 K in 5 years should be able to answer these questions:
1- How many government-backed cryptocurrencies we will have in the next 5 years?
2- How many Business giants (Apple, Google, Amazon, Facebook,... ) backed cryptocurrency we will have in the next 5 years?
3- What would be the rate of adaptation in the next 5 years?
4- what would be the Bitcoin market dominance in the next 5 years?
The answer to the first 3 questions is not clear, but I can talk about the last question.
Bitcoins market dominance trend shows, bitcoin losing its market cap dominance constantly and in the next five years, it is highly likely that this number shrinks more..!
I believe only impossible is impossible, but mathematically Bitcoin will not be able to reach 10,000,000,000,000 market cap (10 Trillion US dollars) in the next 5 years!
If you want to know how big this number is:
There is approximately US$ 40 trillion in circulation: this includes all the physical money and the money deposited in savings and checking accounts.
Total money in the stock market, which is a mere $95 trillion.
Gold's Market Cap
Estimated Market Cap: $11.401 T
The Market Capitalization of Gold is currently around $11.401 T.
This value was obtained by multiplying the current gold price ($1,795 per once) with the world's above-ground gold reserves.
The amount of above-ground reserves for Gold are estimated to be around 197,500 metric tonnes according to the World Gold Council (End-2019). Note that the estimated above-ground Gold reserves can vary by up to 20% from one source to another.
As a consequence, it is safe to say that the current Market Cap of Gold is between $9.121 T and $13.682 T.
10 Trillion dollars is almost equal to the total Gold in the world!
Apple market cap: 2.4 Trillion dollars
Microsoft: 2.2 trillion dollars
As of March 31, 2021, there was nearly US $2.1 trillion in circulation, including Federal Reserve notes, coins, and currency no longer issued. (rankred.com)
The final question for Cathie Wood:
Cathie Wood loves Palantir and claim they have the best AI technology in the world (which could be true).
Palantir has bought 50 million dollars of physical gold recently, while they are discussing the future of bitcoin..!
Why Palantir did not buy Bitcoin instead of Gold???
Numbers do not lie..!
Reference article:
www.rankred.com
Total

TOTAL2 An Avoided DeathcrossLooks like a very clean miss of the death cross
More bull action is coming based on this comparison to the early bull run
Looks great really
Climbing Through the Circles TOTAL2Some circles showing the intersection and connection to the circle as time passes
~2.2 years is my expectation for the current bull run
Previous bull run labelled along with the bear market also
Above is the chart analyzing how I came to the conclusion of 2.2 years

Total Crypto Market Making U Turn.. Beware!!!!As we can see Total crypto market cap is facing strong resistance frm Previous supply zone.

Dump Money May Come Sooner As You Think 🤑Hi everyone,
📍 I have seen a very clear fractal in Bitcoin's chart in 2017 and the current price.
📍 I consider this bull trap and dumb-money. However, if it could manage to break the previous Highs I do not consider it dumb-money anymore.
⚠️ There are also a lot against comparing 2017 and 2021 due to the crypto-currency's infrastructure, regulatory, acceptance,etc. You should consider this just as a scenario.
Wsh everyone a profitable life.
Please share me your opinion and ask me whenever you got any problem and or question

long term uptrendIn the weeklyTIME Frame we are at the top of the channel midline and this is a sign of ascent
THIS WAS JUST A PULLBACK

A Major Trend Reclamation TOTAL2A major trend being reclaimed on the altcoin market
Similarities can be seen to the prior reclamation of the same trend line (in yellow box)
We are in for some more bull action..

TOTAL | H4 | Technical AnalysisThe crypto exchange, which lost $512 Billion (21.45%) in 2 days, is up 10.00% today. The reason for this decrease is a completely natural decrease because the stock market was continuing to rise continuously as of July 21, and the chart was beginning to swell. And no Index ever rises completely; it needs to rest somewhere.
The inflated chart always explodes, the important thing is to find the time and withdraw from the market quickly, so I closed all the coins I shared on Sunday, this decrease was expected. In 2-3 days, the stock market may grow again, but until then, no coin analysis will be shared, and I advise you to stay away from the stock market for these 2-3 days. And if you are going to buy a coin, you should always analyze the exchange "TOTAL" (Crypto Stock Index).

TOTAL2 4Hr AnalysisThe 4Hr chart for TOTAL2 (or the altcoin marketcap)
I think the double top will follow through and bearish action is a possibility if the dotted line doesn't hodl

TOTALTotal market cap supports the rising to new prices, And this confirms the previous analysis that the market is will go up

+10 trillion do you belive?the question is not if but when will the crypto total market cap hit 10 trillion. it is happening sooner than you think

long term uptrendAs long as the price is in the long-term channel
For Bitcoin, we can not imagine a price below $ 30,000

TOTAL MARKETCAP!The Total Index was within the resistance range to which it reacted and experienced a relatively heavy correction market. According to the 4-hour chart, Total was moving within a bullish corner pattern, which, with its loss, seems to have entered a corrective phase in the market.Friends, push the like button, write a comment, and share with your mates - that would be the best THANK YOU.

TOTALThe value of the crypto market has gone out of its uptrend channel
Due to the shape of the Ichimoku cloud and if exciting news is not sent to the market
At best, we will stay in the downtrend for about a month
To return to the first uptrend, there must be absolute fear in the market
In any case, this price drop is just a correction
Do not trade in market excitement and
In the previous sponsorships, buy good COIN step by step
Good luck

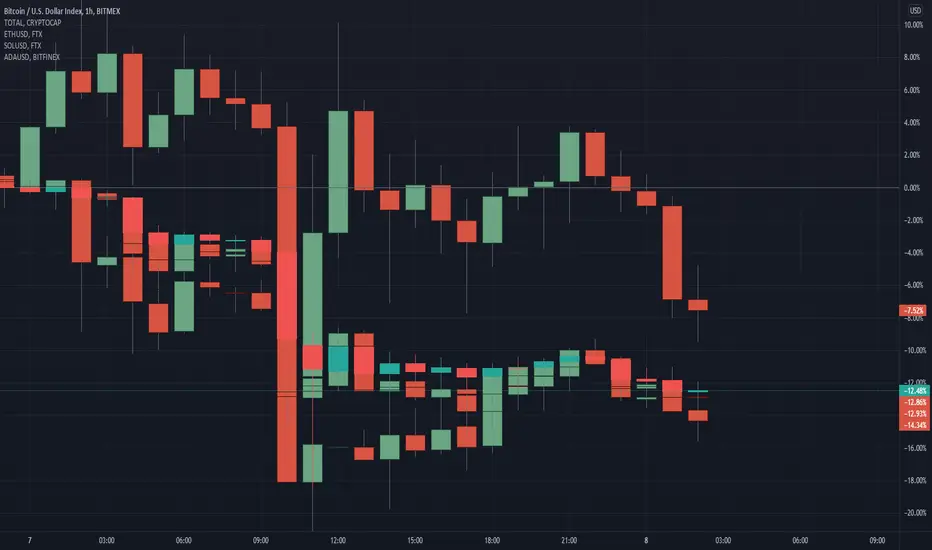
Liquidity Cascade, Whale Effect or a bigger Scheme???In this 5 minute chart, you can see CRYPTOCAP:TOTAL BITMEX:XBT CURRENCYCOM:ETHUSD FTX:SOLUSD KRAKEN:ADAUSD .
This level of coordination couldn't be Liquidity Cascade or Whale Effect.
What is it? I could not find an evidence base reason for it but this phenomenon is so big and fast that could not be Algorithmic trading of institutions or retail traders or what so ever..!
I checked the 1-minute chart as well :
It seems there is a superpower that overrules all other players..!
I am 100% sure this is not the last time this phenomenon happens and it will be repeated again very soon, in less than 100 days..!
Why dont you drop?i don't know why...??!
divergences in any indicator, greedy and fear index, raising wedge on BTC ...
you have fall, but when ?!
Are you waiting for 0.618 time line ??
maybe

China or United States ??? I believe this could not happen due to Tweets or retail traders' reactions to tweets..!
Is it a War between governments???
Is it a new taxation method???
what do you think is the reason behind it?

Crypto Market Capitalization is touching last ATH'sCrypto Market with BTC still has a little road to go until last ATH (red line), but TOTAL ALTS capitalization(without BTC) is touching his last ATH, so its at crucial point right now.
Be careful, tomorrow BTC has a fundamental with El Salvador making it legal money, this can lead to a new 2021 Bull Run or could be the start of a correction, as BTC is touching 68.70% Fibo right now at 52.500.
Regards.
Eng Alexa.

Total market - Target 3200B $. Total market chart Month - Total market break out Ichimoku cloud.
Target 3200 B$

Bitcoin or Altcoins?April 2020 - April 2021 :
Total outperform Bitcoin by 27%
April 2021 - September 2021:
The gap is still 27%
Now let's look at Total 2 and compare it with Bitcoin:
April 2020 - April 2021 :
Total outperform Bitcoin by 660%
April 2021 - September 2021:
The gap is 60%
This comparison clearly shows people tend to invest and trade altcoins..! while Total2 is approaching its all-time high, bitcoin is 25% below its All-time high..!
The story for Ethereum is different!
DISCLAIMER
I’m not a certified financial planner/advisor nor a certified financial analyst nor an economist nor a CPA nor an accountant nor a lawyer. I’m not a finance professional through formal education. The contents on this site are for informational purposes only and do not constitute financial, accounting, or legal advice. I can’t promise that the information shared on my posts is appropriate for you or anyone else. By using this site, you agree to hold me harmless from any ramifications, financial or otherwise, that occur to you as a result of acting on information found on this site.

I was close. Double Top or Bump and Run to Cup and Handle? ATHWill it pop? We're getting close to a saucey cup. What do you think?

total markets mapOverview of the whole market in the medium term Of course, if the canal ceiling breaks, the issue will be different

TOTAL (Crypto Total Market Cap)As we can see, we can expect more Fall from the Crypto market cap ...
